
2.1: Clinical Techniques- Assessment of Vital Signs
- Page ID
- 41651

Vital signs are measurements of the body’s most basic functions. The four main vital signs routinely monitored by medical professionals include the following:
- Body temperature in degrees Celsius (°C) or degrees Fahrenheit (°F)
- Pulse rate in beats per minute (bpm)
- Respiration rate or rate of breathing in breaths per minute (bpm)
- Blood pressure or systolic over diastolic pressure
Comparing patients’ vital sign measurements to the normal range of values is useful for detecting changes in the physiology or medical problems. In this lab, we will also assess your Body Mass Index (BMI) or body composition. Keeping track of the BMI offers numerous health benefits, such as helping to reduce the risk of cardiovascular disease.
Lab 1 Learning Objectives
In this lab, you will learn the basic methods for determining a patient’s vital signs.
- Body temperature measurement and conversion
- Determination of pulse rate rate per minute
- Measurement of breathing rate per minute
- Taking and analyzing blood pressure readings
- Measurement and analysis of body weight and body fat composition
What is normal body temperature?
The body temperature of a person fluctuates depending on environmental temperature, activity, food and fluid consumption, time of day, and, in women, the stage of the menstrual cycle. Although the average human body temperature is usually stated as 37°C (98.6°F), a systematic review of the literature has found normal oral body temperature can range from 91.76-100.76°F in healthy adults (Sund-Levander et al., 2002). With this in mind, it is important to compare body temperature readings to baseline values for an individual.
Body temperature readings may reflect the core body temperature (temperature of the internal organs) or the temperature of the body’s shell (body surfaces which change temperature due to environmental exposure). Typically, the core body temperature is slightly higher than the shell temperature.
A person’s body temperature can be measured in several ways:
- Orally. The body temperature can be taken by mouth using either the classic glass thermometer or modern digital thermometers that use an electronic probe. The average normal oral temperature is 98.6°F (37°C).
- Rectally. Temperatures taken rectally (using a glass or digital thermometer) measure core body temperature; readings are typically 0.5°F (0.3°C) to 1°F (0.6°C) higher than the oral temperature.
- Axillary. The temperature can be taken under the arm using a glass or digital thermometer. An axillary temperature is usually 0.5°F (0.3°C) to 1°F (0.6°C) lower than the oral temperature.
- By ear. An infrared tympanic thermometer can quickly measure the temperature of the ear drum, which reflects the body’s core temperature (the temperature of the internal organs). Tympanic temperature is 1°F (0.6°C) higher than the oral temperature. Note that tympanic measurements may be impeded by earwax in the ear canal.
- By skin. A non-contact infrared temporal thermometer can quickly measure the temperature of the skin on the forehead, reflecting the temperature of the blood in the temporal artery. The forehead scanner temperature is usually 0.5°F (0.3°C) to 1°F (0.6°C) lower than the oral temperature.
Body temperature may be abnormal due to fever (high temperature) or hypothermia (low temperature). According to the American Academy of Family Physicians, fever is indicated when body temperature rises one degree or more over the normal temperature of 98.6°F (or one degree over the individual’s baseline temperature). Hypothermia is defined as a reduction in body temperature below 95°F.
In the laboratory, you may need to convert between Celsius and Fahrenheit temperature readings.
Convert Celsius to Fahrenheit: °F = (°C × 9/5)+ 32 or °F = (°C × 1.8) + 32
Convert Fahrenheit to Celsius: °C = (°F – 32) / (9/5) or °C = (°F – 32) / 1.8
The Components of the Body’s Thermoregulatory System
The body’s thermoregulatory efforts are coordinated by a number of different centers in the brain, the most important of which is the hypothalamus, a region located in the base of the brain just above the pituitary gland. Input to these brain centers comes from the thermoreceptors located within the brain itself. There, receptors, known as central thermoreceptors, are important because they monitor the temperature deep within the body, known as the core temperature. Other thermoreceptors, called peripheral thermoreceptors, are located in the skin and detect more variable temperatures found at the body’s surface.
Output from brain thermoregulatory centers is transmitted by neurons to various effectors that vary the rate of heat production or loss in order the stabilize body temperature. The effectors include sweat glands, which control evaporative heat loss by increasing or decreasing sweat secretion; blood vessels in the skin, which control conductive and radiative heat loss by increasing or decreasing the blood flow to the skin’s surface; and skeletal muscles, which control heat production through shivering– involuntary contractions that generate heat as a metabolic by-product. When the core temperature changes, brain thermoregulatory centers attempt to compensate by sending appropriate commands to these effectors.
How body temperature is maintained within the normal range. The body temperature normally has a set point of 37°C (98.6°F). During exposure to ambient temperatures between 25-30°C, the human body is within its thermoneutral zone. When the environmental temperature is within the thermoneutral zone, alteration of blood flow through the skin is enough to stabilize the core body temperature. Blood vessels near the body’s surface constrict to conserve body heat when the temperature is too cool – this process of decreasing blood vessel diameter to restrict blood flow is called vasoconstriction. The same cutaneous vessels dilate to radiate heat from the skin when the body is too warm. Increasing the blood vessel diameter is called vasodilation. When cutaneous vessels vasodilate, they radiate excess heat from the skin to the external surroundings.
When body temperature begins to diverge farther away from the set point, two antagonistic mechanisms can bring it back to a normal value: shivering and sweating. Shivering is induced when the body temperature falls too low, and subsides through negative feedback when the temperature returns to normal. Sweating occurs when the body temperature is too high, and it diminishes as the core body temperature falls.
What is the pulse rate?
The pulse rate is a measurement of the heart rate, or the number of times the heart beats per minute. As the ventricles of the heart contract and pump blood through the arteries, the arteries expand and contract with the flow of the blood. Taking a pulse not only measures the heart rate, but also can indicate the following:
- Heart rhythm
- Strength of the pulse (strength of heart contraction)
The normal resting pulse for healthy adults, ranges from 60 to 100 beats per minute. The pulse rate may fluctuate with exercise, illness, injury, and emotions. Females ages 12 and older, in general, tend to have faster heart rates than do males. Athletes, such as runners, who do a lot of cardiovascular conditioning, may have heart rates near 40 beats per minute.
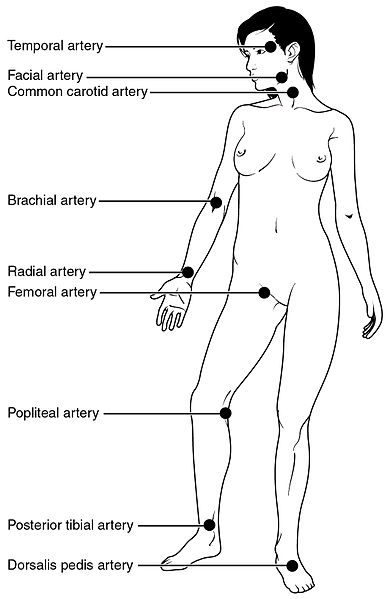
As the ventricles of the heart contract and force blood through the arteries, you can feel the beats by pressing on the arteries, which are located close to the surface of the skin at certain points of the body. The pulse can be found on either side of the neck, at the carotid arteries, at the cubital fossa in the antecubital area on the brachial artery, or at radial artery at the wrist. For most people, it is easiest to take the pulse at the radial artery. If you use the carotid arteries in the neck, be sure not to press too hard, and never press on both arteries on the sides of the lower neck at the same time to prevent blocking blood flow to the brain.
Your pulse indicates the number of contractions made by the left ventricle of your heart each minute. Your heart controls your heart rate intrinsically, with each contraction. No nervous stimulation is required in order for the heart to contract.
When taking your pulse at the wrist: place two fingers over the radial artery (Figure 1) on the lateral side of your wrist. When you find the pulse, count the number of beats for 60 seconds (or count for 30 seconds and multiply by 2).
Although the heart muscle is autorhythmic, it responds to the controls of the autonomic nervous system (ANS). The sympathetic nervous system may increase the heart rate and pulse under stressful situations such as emotional trauma, physical exertion or injury with blood loss (hypovolemic shock) and/or infection. A resting heart rate over 100 bpm is considered tachycardia, which, if prolonged, may be a sign of coronary disease. In the case of blood loss, an elevated heart rate is a compensatory response to hemorrhage. Decreased arterial pressure due to low blood volume initiates the baroreceptor reflex, which increases sympathetic stimulation of the heart, increasing heart rate, cardiac output and arterial pressure. On the other hand, the parasympathetic nervous system alwaysmodifies the heart rate by decreasing it via the Vagus nerve.
What is the respiration rate?
The respiration rate is the number of breaths a person takes per minute. Normal respiration rates for an adult person at rest range from 12 to 18 breaths per minute. The rate is usually measured when a person is at rest and simply involves counting the number of breaths for one minute by observing how many times the chest rises. Respiration rates may increase with fever, illness, trauma, and other medical conditions. In addition, note that lung sounds observed with a stethoscope should be fluid without any clicking, bubbling, rattling or wheezing, as these also indicate potential disease.
Respiration allows your lungs to acquire oxygen and eliminate carbon dioxide. Oxygen is used in cellular respiration as the final electron acceptor when mitochondria make the ATP that is used as fuel for cellular work. Carbon dioxide is made as you break down the body’s fuel molecules to make ATP. When you are doing more cellular work such as exercising, your respiratory rate increases because you require more ATP and produce more carbon dioxide. Your medulla oblongata sets the respiratory rhythm by alternately stimulating inspiration (inhaling) and expiration (exhaling). Respiratory rhythm is modified by the pons to correct for activities such as exercising or talking.
Typically circulatory function is assessed along with the respiratory rate. Paleness may be caused by reduced blood flow, reduced blood oxygen, or by the reduced function of red blood cells. The skin or mucous membranes of the body may indicate the relative health of the respiratory, pulmonary, and cardiovascular systems because these tissues have many superficial vessels. These tissues become discolored (become gray, white, or blue opposed to the healthy pink color) when the blood is not properly circulated or oxygenated. Because skin color alone is not a sufficient indicator for all people, it is important to assess the color of the oral mucosa and conjunctival membranes when checking a patient for adequate circulatory function. See the “visual assessment of circulatory function for all skin tones” link in your course module to view examples of pallor and central cyanosis.
What is blood pressure?
Your Systemic Blood Pressure measurement indicates the pressure in your peripheral arteries when the left ventricle of the heart is pumping blood to systemic arteries, called the systolic pressure, as well as the pressure in the systemic arteries when the ventricles are relaxing and filling with blood, called the diastolic pressure. Blood pressure is reported as systolic pressure over diastolic pressure. The units (mm Hg) cancel each other out and are not reported.
Pulse pressure is the difference between the systolic and the diastolic pressures. For example, if your Blood Pressure is 120/80, the pulse pressure would be 120-80=40. In older adults (60+ years) a pulse pressure greater than 60 can be an indicator of cardiovascular disease, a predictor of heart attacks, and may also reflect leaky heart valves due to age-related losses in aortic elasticity. In turn, a pulse pressure less than 40 may indicate poor heart function.
Systolic and diastolic pressure should be considered alongside pulse pressure values. Higher systolic and diastolic pairs imply higher risk than lower pairs with the same pulse pressure: 160/120 indicates a higher risk than 110/70 even though the pulse pressure in each pair is 40.
The most important cause of elevated pulse pressure is the stiffness of the aorta. The stiffness may be due to high blood pressure or fatty deposits damaging the walls of the arteries, leaving them less elastic (atherosclerosis). The greater your pulse pressure, the stiffer and more damaged the vessels are thought to be.
Three important factors affect Blood Pressure: Cardiac Output, Peripheral Resistance and Blood Volume. Increasing any of these factors will increase blood pressure.
- Cardiac Output is the volume of blood pumped per minute; both the heart rate [beats per minute (bpm)] and the stroke volume (volume pumped per minute) affect it.
- Peripheral Resistance is the resistance of arteries to blood flow and is affected by three factors: vessel length, diameter, and the viscosity of the blood. Increasing the peripheral resistance through any of the following three factors increases blood pressure:
- Vessel length: When blood vessels lengthen, peripheral resistance increases. Adipose tissue mass is an important factor, in that, miles of small blood vessels supply each pound fat. Therefore, extra adipose tissue increases peripheral resistance and blood pressure.
- Vessel diameter: When blood vessel diameter decreases, peripheral resistance increases. Blood vessel diameter is increased via vasodilation to deliver more blood to active tissues. When vasoconstriction occurs, the blood flow is more turbulent and the blood pressure increases.
- Blood viscosity: Increasing blood viscosity or “stickiness” increases peripheral resistance. When there are elevated amounts of blood cells or blood proteins, the blood becomes more viscous and is not easily pumped, causing elevated blood pressure
- Blood Volume, the total blood volume in the average-size adult (150-160 lbs), fluctuates but averages about 5 liters, constituting approximately 8% of the total body weight. Blood volume may decrease below normal values due to blood loss or dehydration. A reduced total blood volume will reduce the cardiac output (volume pumped per minute) by decreasing venous blood return to the heart. Blood volume may increase beyond normal values due to pregnancy and/or excess water and sodium retention (which may be due to a high sodium diet or other physiological factors).
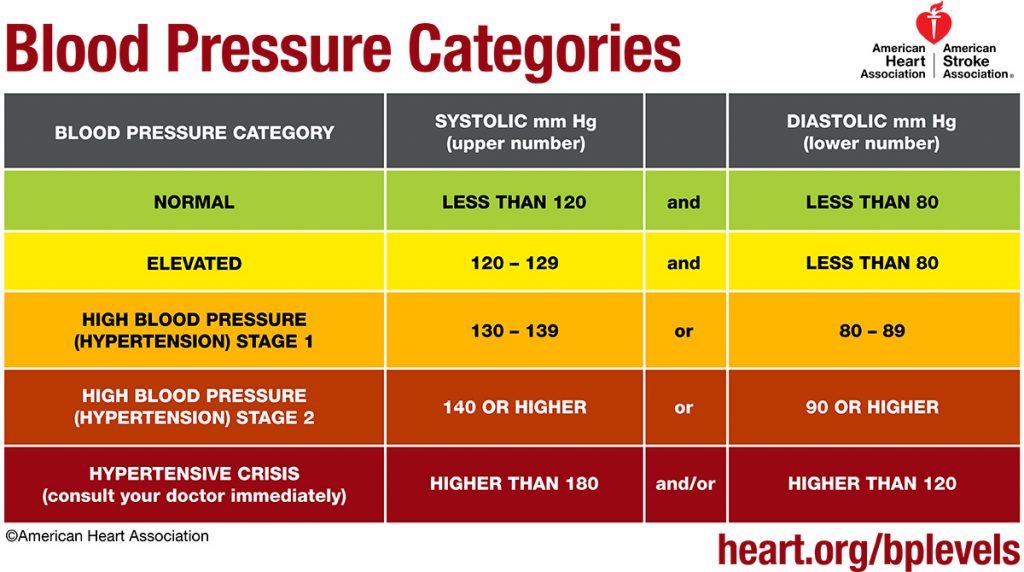
The 2017 Blood Pressure Guidelines
In 2017, the American Heart Association amended previous blood pressure recommendations for adults. The changes are summarized in the table (below). The American Heart Association currently defines a normal healthy adult blood pressure as a blood pressure with systolic pressure less than 120 mm Hg and a diastolic pressure less than 80 mm Hg. A normal blood pressure of 117/79 is read as “117 over 79.”
Blood pressure is considered elevated if the systolic pressure is between 120-129 and the diastolic pressure is less than 80 mm Hg. Hypertension is when the pressures, either systolic or diastolic, are greater than these parameters. Temporary elevations in blood pressures are normal with exciting events, disturbing situations and physical exertion. Long-term hypertension, referred to as chronic hypertension over-works the heart leading to a weakening of the heart’s pumping efficiency. Chronic hypertension is called a “silent killer” as damage to the heart has taken place before it is detected.
Hypotension occurs when blood pressure is too low. In most cases, the lower the blood pressure, the better. If an individual has a systolic pressure under 90 or diastolic pressure under 60 and is experiencing certain chronic, low blood pressure symptoms such as dizziness, nausea, fainting or blurred vision, they may be diagnosed with hypotension. In this case, the underlying cause must be established. On the other hand, acute hypotension may occur with blood loss or severe dehydration and may constitute a medical emergency.
Body position and BP measurement: Blood pressure may be measured in the sitting, standing or supine (lying down) position. However, it should be noted that blood pressure results are affected by body position and arm position (at heart level or above/below heart level). For example, it is widely accepted that blood pressure is highest in the supine position. While standing, the pull of gravity causes blood to pool in the veins of the legs, somewhat reducing venous return to the heart. Reduced venous return reduces cardiac output and thus reduces the arterial pressure in a standing patient (see Equation 1). This drop in blood pressure is transient in normal individuals because the baroreceptor reflex, which initiates sympathetic stimulation of heart contraction, increases heart rate and blood pressure in response to low pressure values.
A good clinical example of changing body position and blood pressure is that of orthostatic, or postural, hypotension. In orthostatic hypotension, an individual may experience an exaggerated fall in blood pressure when moving from a supine (or sitting) to a standing position, leading to light-headedness or syncope. Orthostatic hypotension is also normally resolved by the baroreceptor reflex.
What is Body Mass Index (BMI)?
BMI measures the amount of fat in your body relative to your height and weight. Percentage of body fat is strongly associated with the risk of several chronic diseases, such as hypertension, dyslipidemia (a condition marked by abnormal concentrations of lipids or lipoproteins in the blood), diabetes mellitus and coronary heart disease. Your body composition can be found by a number of methods; we will utilize Bioelectrical Impedance and Body Mass Index (BMI).
Bioelectrical Impedance Analysis (BIA) is based on the principle that electric current flows at different rates through body tissues depending upon their composition. The body is composed mostly of water and ions, through which an electric current can flow. Total body water is contained in two compartments: extra-cellular water (ECW, approximately 45% and intracellular water (ICW, approximately 55%). The body is also composted of non-conducting materials, such as body fat (adipose tissue), which provide resistance to the flow of electric current. Adipose tissue contains only about 20% water, so it impedes (slows) the flow of electric current; thus, it is considered to have high impedance. Muscle contains about 75% water and allows the electric current to pass through at a faster rate, so it has low impedance. The bioelectrical impedance of the entire body, therefore, reflects the proportion of body fat to fat-free tissue (muscle and bone).
Since, the principle of BIA is that electric current passes through the body at a different rate depending on body composition, there is a direct relationship between the concentrations of ions and the electrical conductivity and an indirect relationship between ion concentrations and the resistance of the solution. Our findings will be based on the principle that adipose tissue impedes electric current more than muscle and bone.
| BMI for Adults | Weight Status |
|---|---|
| Below 18.5 | Underweight |
| 18.5—24.9 | Normal |
| 25.0—29.9 | Overweight |
| 30.0 and Above | Obese |
Normal percentage of body fat is dependent on age and sex. The table below shows the percentage of body fat changes continuously as one ages, and it is different depending on sex. In females, sex hormones will affect the percentage of body fat through the lifespan. Physical activities may also affect body composition and the percentage of body fat.
| Age | 18-39 years | 40-59 years | 60-99 years |
|---|---|---|---|
| Females | 21-33% | 23-34% | 24-36% |
| Males | 8-20% | 11-22% | 13-25% |
Laboratory Methods
Note: Some techniques will not be used in this week’s lab due to COVID-19 modifications.
Week 1 Laboratory Exercises
The following materials provide instructions for completing laboratory 1.
Download your lab report from Canvas to record your vital signs data.
Note: In this laboratory, some measurements will be taken multiple times. These repeated measurements, or replicates, are important for data integrity in experimental studies. There are several reasons why repeated measurements may not be the same: differences may reflect real physiological or environmental changes, or differences may be caused by instrument error or human error.
Part 1. Body Temperature
Normal adult body temperature is about 98.6 degrees Fahrenheit (°F) or 37 degrees Celsius (°C), but body temperature often varies from 1 to 2 °F or ½ to 1 °C throughout the day.
Measuring the Oral Temperature Using a Digital Thermometer
- Before starting, clean the thermometer with 70% Isopropyl Alcohol pad and allow the probe to dry.
- Place a new disposable probe cover over the probe before each use.
- Press the power button.
- If the next screen only shows °F, you will need to calculate and record the oral temperature in °C as well.
- Place the digital thermometer probe in your mouth with the tip pressed firmly under the tongue. Close your lips around thermometer and wait until the thermometer beeps.
- Record the oral temperature in °F & °C.
- Complete three total replicates, recording oral temperatures in both °F & °C on the lab report. Calculate and record the mean of the three trials.
- Push the power button to clear the reading and remove the disposable probe cover. Wipe the thermometer probe with an isopropyl alcohol pad, and return it to its plastic case.

Measuring the Tympanic Temperature
As with the oral thermometer, clean the probe of the tympanic thermometer with alcohol before and after use. Cover the probe with a plastic tympanic probe tip cover. Gently insert the probe into the ear canal until the canal is sealed.
You will record three replicates of the tympanic temperature. Wait at least one minute between replicates to allow the ear canal temperature to return to normal after being in contact with the probe. Use the formula to convert between °F and °C if necessary and calculate the mean.
Measuring the temporal temperature with a non-contact infrared thermometer (NCIT)
It is important to follow the specific guidelines for the manufacturer’s exact model of temperature scanner. Use the NCIT in an area devoid of drafts and direct sunlight. Do not touch the scanning area of the thermometer. The subject should remain stationary while taking the measurement.
Turn the power button on. Hold the scanner perpendicular to the forehead (scanning area anterior and superior to the eyes) at the manufacturer’s specified distance. Press the measure button or trigger to obtain the reading. If you are taking your own temporal temperature, you may use a mirror to see whether the scanner is correctly positioned. Record three replicates of the temperature and enter these in the table on the lab report. Use the formulas to convert between °F and °C if necessary, and calculate the mean.
Part 2. The Pulse
When left ventricle of the heart contracts and ejects blood into systemic circulation, waves of blood press on the walls of the arteries, causing a pulsation. This pulsation can be detected manually when the arteries are sufficiently close to the surface of the skin. For example, the pulse can be detected on either side of the neck, at the carotid arteries, or on the radial artery at the wrist. The normal pulse rate for a healthy adult is 60-100 beats per minute but an elite athlete may have a resting pulse range from 40-60 beats per minute.

Measuring the pulse
- Using the first and second fingertips, press firmly but gently on the radial artery until you feel a pulse.
- Count pulsations for 60 seconds (or for 15 seconds and then multiply by four to calculate beats per minute).
- When counting, do not watch the clock continuously, but concentrate on the beats of the pulse.
- Complete three total replicates, recording the pulses on your lab report. Calculate the mean of the three pulse readings.
Part 3. Respiratory Rate
The normal respiratory rate for a healthy adult at rest is 12-16 breaths per minute.
You will count the number of breaths a person takes in one minute. This should be done when the person has been at rest for at least five minutes. Simply watch the rise and fall of a person’s chest when the person is not aware that you are taking their respiratory rate. It is not unusual to get erroneous resting respiratory rates when the person knows you are assessing their breathing.
- Count the respiratory rate of your lab partner once they have been in the seated resting position for more than five minutes.
- Count the rise and fall of the chest or shoulders for 30 seconds and multiply that number by 2.
- Conduct three total trials and record the mean.
Listening for Lung Sounds with a Stethoscope
A stethoscope is an acoustic device used for hearing breathing sounds and for taking blood pressure. Sound is amplified by the bell and diaphragm at the end of the tubing of the stethoscope (Figure 5). The diaphragm amplifies high-frequency sounds (like respiratory sounds), and the bell amplifies low-frequency sounds. The ear tips should be directed into the ear canal and slightly forward-facing.

After assessing respiratory rate, use the stethoscope to perform auscultation of your partner’s lung sounds. Use the diaphragm to listen to your partner’s lungs through their shirt. Have the student inhale and exhale deeply through the mouth. Listen at each site indicated in Figure 6.
- Upper Right and Left Quadrant
- Lower Right and Left Quadrant
Listen for any abnormal noise (crackling or wheezing) and note it for the appropriate quadrant. Record your findings on your lab report. If you hear no noise, chart the lung sounds as clear in all quadrants.

Assessing circulatory function
Because many blood vessels exist near the surface of the skin and mucous membranes, these areas can be assessed for adequate circulation. In lighter skin colors, the underlying skin will normally have a pink undertone indicating perfusion of the tissue. In individuals who have tan or darker skin tones, perfusion should be assessed in the fingernail beds, lips, tongue/mucous membranes of the mouth, the underside of the arm and hand, and the conjunctiva of the eye.
In general, poor circulation may cause the skin, oral and conjunctival membranes to appear pale or gray. This is called pallor. When the blood is not properly oxygenated, skin and membranes that overlie blood vessels may turn bluish in color (cyanosis). Additionally, chronic illness like liver disease may turn the skin and sclera of the eyes yellow (jaundice).
Part 4. Blood Pressure
Blood Pressure (BP) measurement indicates the 1.) pressure in peripheral arteries when the left ventricle of the heart is pumping blood to systemic arteries (the systolic pressure) and 2.) the pressure in the systemic arteries when the heart is relaxing and filling with blood (the diastolic pressure).
Blood pressure is reported as systolic pressure over diastolic pressure, the units (mm Hg) cancel each other out and are not reported. Normal healthy adult Blood Pressures should have the systolic pressure below 120 mmHg and the diastolic pressure between 70-80 mmHg. Remember the units (mmHg) cancel each other out and are not recorded.
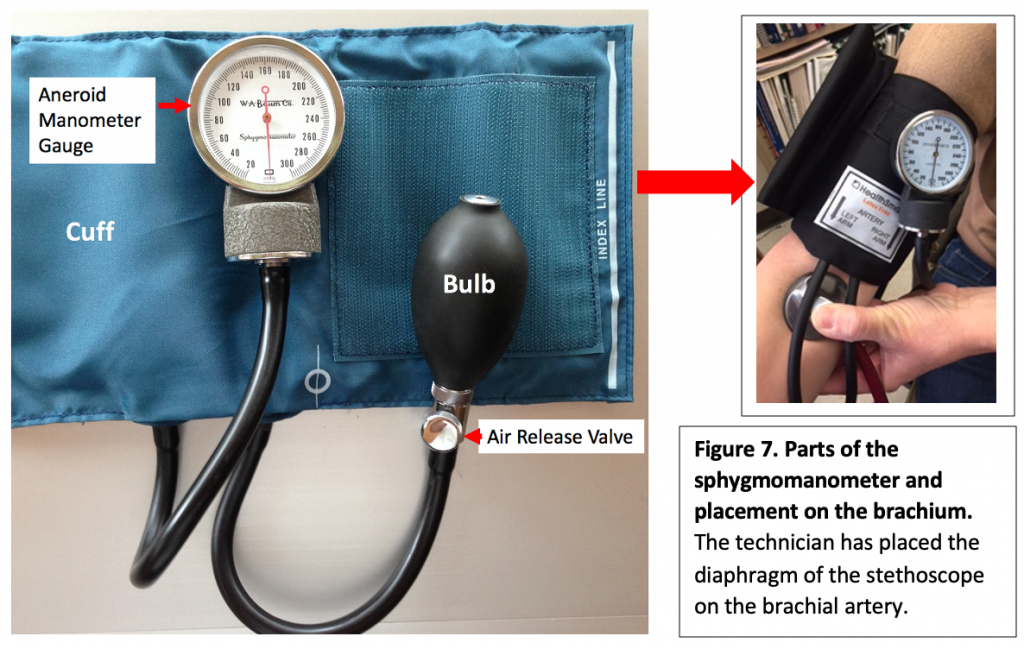
How to take a blood pressure using the sphygmomanometer and stethoscope:
- Before beginning obtain a sphygmomanometer (Figure 7) and a stethoscope (Figure 5). Wipe the diaphragm and the earpieces of the stethoscope with an alcohol pad.
- Place the cuff on the brachial area of the arm with the lower edge above the cubital fossa.
- Align the artery label on the cuff with the brachial artery.
- Wrap the cuff tightly around the arm, so it doesn’t slide around.
- Rest the subject’s arm on the table with the cuff at the same level as the subject’s heart.
- Palpate the brachial artery for correct placement of the diaphragm of the stethoscope.
- Put on the stethoscope and place the diaphragm of the stethoscope on the brachial artery.
- Place your thumb on the head of the stethoscope and your fingers on the posterior aspect of the subject’s arm to secure the stethoscope in the proper position.
- Make sure the manometer is clipped securely to the gauge holder.
- With your free hand, secure the air release valve enough to inflate the cuff without any air escaping.
- Inflate cuff by squeezing the inflation bulb while watching the needle in the Aneroid Manometer Gauge advance to about 160 mmHg. No sound should be heard through the stethoscope.
- Stop squeezing the inflation bulb and start to slowly release air from the cuff by turning the air release valve with your thumb and index finger.
- Listen for the first sound, the “Sounds of Korotkoff” which is the turbulence made by the blood as it flows through the brachial artery again once the pressure of the cuff decreases (Figure 8).
- The first Sound of Korotkoff is a “tapping” sound. Makenote of the number on the Aneroid Manometer Gauge at which you first heard this sound. This is the Systolic Pressure.
- Continue to slowly deflate the cuff. You will hear the sound of the turbulence decrease until you no longer hear any sound. Note the number on the Aneroid Manometer Gauge when you no longer heard any soundand record this as the Diastolic Pressure.
- Make sure the cuff is fully deflated and record the BP measurement in the lab report.
- Retake the BP two more times on the same arm making sure the equipment remains in the same position and the arm is at the same level of the heart. Wait a few minutes in between measurements, and make sure cuff is fully deflated in between trials. Record the three measurements in the lab report, and calculate the mean of the three trials.

Part 5. Body Mass Index
Remove your shoes, and go to the wall in your lab room that has the tape measure taped to the wall. Measure your height with your lab partner holding a 12-inch ruler or pen at the top of your head, making sure the ruler or pen is parallel with the floor.
- Record your height in cm
- Have your height in centimeters ready before going to the scale
- Follow the posted instructions on how to use the laboratory scale
- Please give students using the scale privacy while recording their data
Imperial English BMI Formula: weight (lbs) x 703 / height (in2)
Metric BMI Formula: weight (kg) / height (m2)
Sources for this exercise
- Haen, K.M. Biology 256 lecture. Spring 2017.
- Sund-Levander M, Forsberg C, Wahren LK. Normal oral, rectal, tympanic and axillary body temperature in adult men and women: A systematic literature review. Scandinavian Journal of Caring Sciences 2002; 16: 122–128.
- Stanfield, Cindy L., and William J. Germann. Principles of Human Physiology. Third ed., San Francisco, Pearson, 2007, pp. 13-15.
- Fox, S. I. (2013). Human Physiology (13th ed., pp. 7-8). New York, New York: McGraw Hill.
- Krumhardt, Ph.D.,M.T. (ASCP), B. (2013). Exercises in Human Physiology with Personal Health Assessment (Revised ed., p. 18). Redwood City, CA: Star Publishing Company, Inc.
- Dehghan, M., & Merchant, A. T. (2008, September 9). Is bioelectrical impedance accurate for use in large epidemiological studies? Nutrition Journal, 7(26). https://nutritionj.biomedcentral.com/articles/10.1186/1475-2891-7-26
Electronic Resources
- Hopkins Medicine: Vital Signs (Body Temperature, Pulse Rate, Respiration Rate, Blood Pressure) Last accessed June 26, 2017.
- Mayo Clinic: Pulse pressure: An indicator of heart health? Last accessed June 26, 2017.