
2.2: Introduction to Data Acquisition in Human Physiology
- Page ID
- 41652

This week’s activity will teach you the basics of how to use the iWorx hardware and software that will help you acquire data for most of the physiology labs this semester. This activity uses a pulse plethysmograph or a pulse oximeter, sensors that record and measure pulse waves, to quantify the sensation you feel when physically taking a pulse with your two fingers over an artery.
The data acquisition hardware used in 256L is iWorx, and the software that interprets raw iWorx data is called LabScribe.
Turn off and put away phones before starting any experiment.
For the first lab, your research team should create a folder on the desktop of the lab computer to keep your group’s files in.
Sensors should be secured snugly, but not too tight to prevent blood flow or compress underlying tissues. Subjects should sit as quietly and motionless as possible while the device is recording.
Click Record to begin taking data. As soon as you start recording, type the subject’s name in the Mark Box to denote the subject’s data. Click Stop to quit recording data.
Save .iwxdata files to your folder with a descriptive name, so you can find the data later.
For all Biol 256L experiments, students will work in assigned lab groups (your 256L research team). During experiments, each student will record his or her own data by taking turns serving as the experimental subject. To fully participate, students should rotate through the following roles:
- Subject
- Student(s) helping the subject
- Reader of experimental methods
- Computer operator
PART I. Preparing for the iWorx lab
This lab is a basic introduction to how to use iWorx hardware and software, created by iWorx.
To Open Labscribe and begin an experiment, follow this Set-Up sequence each time you begin a Lab Experiment. Make sure each step is completed in order.
- Turn On iWorx Unit Box on Lab Table at the switch at the back of the box. Make sure Green Light is lit and all equipment is attached to the iWorx box.
- Log into the computer using your ISU ID.
- Click the folder icon in the lower left task bar.
- Click “this PC” in the left side task bar.
- Double click the Biol 256L Course Materials P-Drive under Network Locations.
- Double click the “Week 2 Pulse Oximeter” setup file.
- Click OK to the Hardware Found Box, if it appears.
After the experiment file is opened, the below screen will appear (Figure 1).

You will either use a pulse plethysmograph or pulse oximeter as the sensor for this activity. Both record the arterial pulse in a finger. The data on the Labscribe screen should look like smooth waves, representing the cardiac cycle. If you get a lot of inconsistent, messy waves, the sensor may not be appropriately attached, or the subject may be moving.

PART II. Placing the Pulse Plethysmograph or Pulse Oximeter
- Pick the experimental subject.
- Snugly velcro the plethysmograph with the white, flat side facing the finger pad on the middle finger or thumb. It should be snug!, but should not be so tight to compress arteries and diminish the signal.
- If a pulse oximeter is used, simply clamp the oximeter onto a finger as shown on picture on the sensor.
- Subject should sit away from the table, quietly, with palms up, in his or her lap. The subject (and attached wires) should not be touched or moving.
- Check to make sure personal electronic devices are off and put away.
PART III: Recording Data and Adding Marks
How to make Marks on a Recording for Noting Who the Data Belongs to in the Data File:
Large amounts of data can be recorded with LabScribe software, but, to be useful, the data that is interesting needs to be located and retrieved easily. Most often, data from multiple people (you and your lab team members) will all be recorded in the same file. Specific sections of data can be located or distinguished from other sections by placing marks and comments at those locations in the data file. Marks, with or without text comments attached, can be placed on the data during or after the recording.

To practice adding marks with comments during a recording, follow these instructions:
- Click Record (Figure 3, above, Large Red Circle.)
- If necessary, adjust the height of the traces on the Pulse and Heart Rate channels by using the AutoScale buttons (Figure 3 Small Red Circles) to help you see the data better.
- During data recording, an active text cursor appears in the Mark Box (Figure 3 Blue box). Type the subject’s name in the Mark Box using the keyboard.
- Press the Enter key on the keyboard to place the mark on the recording. The wording typed in the Mark box will appear in the lower right-hand corner of the data screen and move along with the subject’s data.
- Record for 60 seconds once the pulse wave pattern in the upper window looks like a regular (periodic) wave.
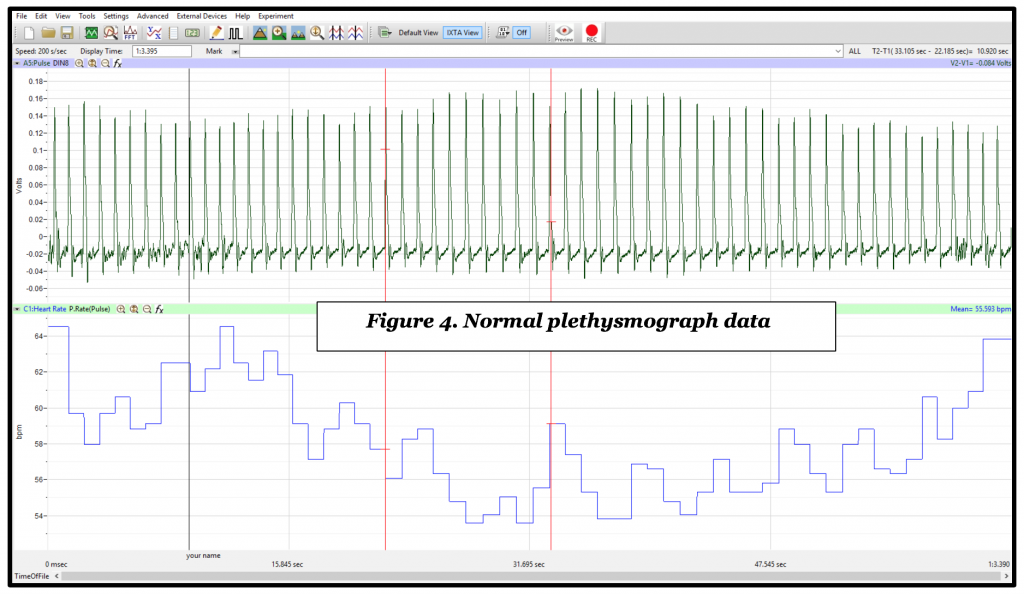
- After collecting normal data for 60 seconds, click on the Stop button to end the recording. Your recording should look similar to the example data screen in Figure 4.
PART IV: Saving your Data
Open the File menu and Select Save As in the File menu, type a name for the file. Choose a destination on the computer to which to save the file, like a lab group folder on the Desktop). Designate the file type as Your Lab section # and your Table # .iwxdata. Click on the Save button to save the data file (Ex. Section4Table2.iwxdata).
To save a file:
- Open the File menu and click “Save As.”
- Enter a descriptive file name.
- Save file to your group’s folder.
- Next, help others serve as the subject.
Go to the Week 2 Lab Report you downloaded or printed from Canvas and follow the instructions for completing your portion of the activity. Once your own data is gathered, another student will be the subject of this activity and others at the table will rotate duties.
Note: you may want to record all the subjects’ pulse data before helping each other do the data analysis on the lab report, but remember to correctly MARK EACH SUBJECT’S DATA, so you can find it later!
PART V. Data Analysis
Note: you may hover over LabScribe software icons to see the function of each button.
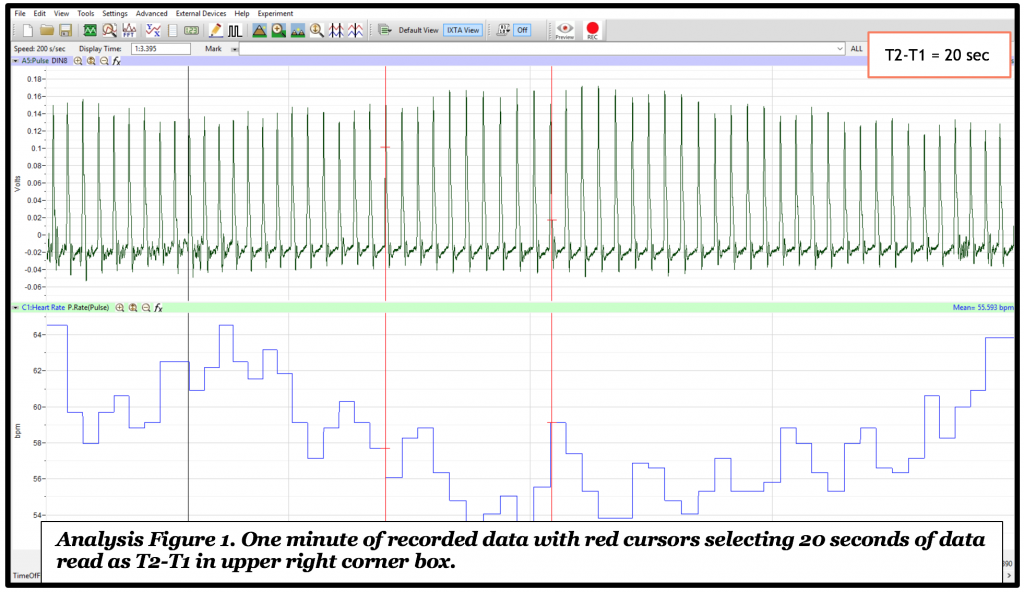
- Find a 20 second portion of your Pulse data. To do this click on Double Display Time.
- Click on the Two Cursors mode and move the cursors until you see that you have 20 seconds listed as T2-T1 on the top right tool bar (Analysis Figure 1, below).
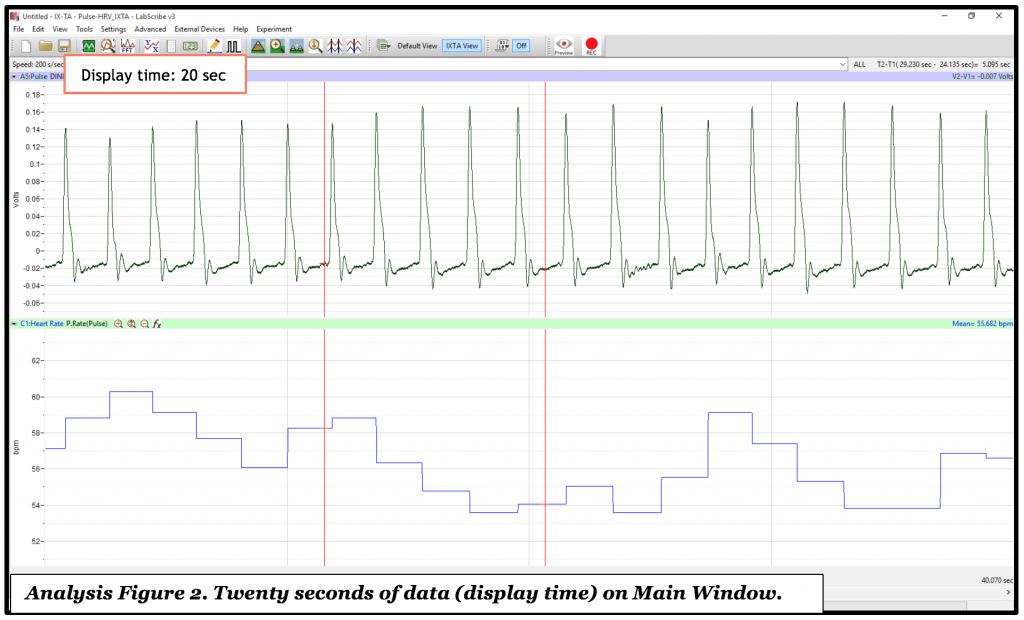
- Next, click on the Zoom Between Cursors icon. Now the segment of pulse waves on your screen is just 20 seconds of your recording on the Main Window (see display time in upper task bar) (Analysis Figure 2, below).
- Click the Analysis icon (magnifying glass over a graph) to switch to the data Analysis screen.
- Next, place the first cursor at the very peak of the first wave and the second cursor on the very peak of the second pulse wave (similar to what you see for the two waves in Analysis Figure 3). When the cursor is close to the peak, you may use the arrow keys on your computer keypad to move the cursor precisely to the top of the peaks.
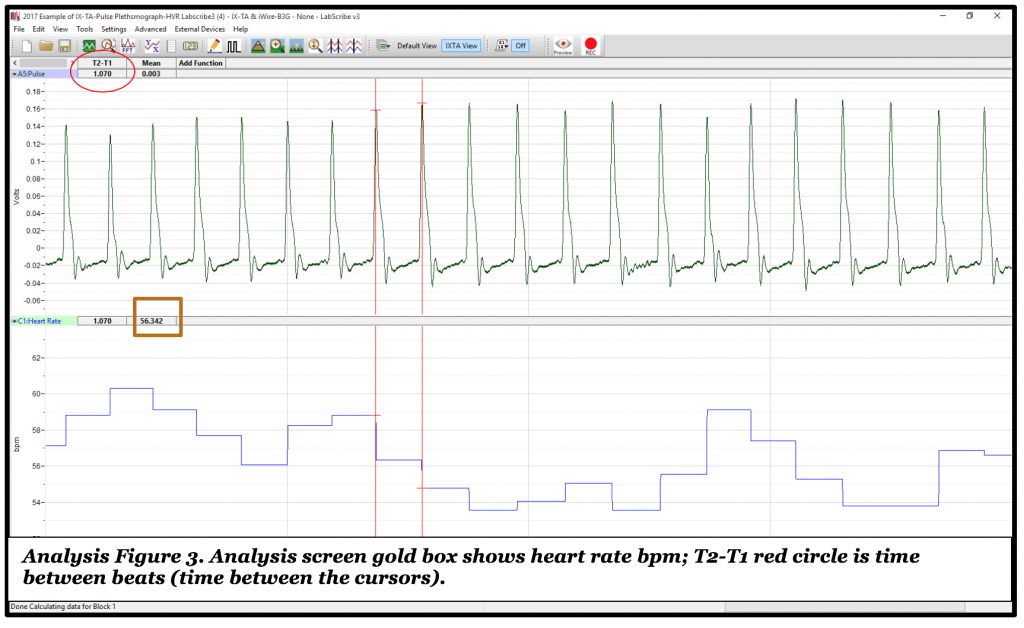
- In your Lab Report Table record the Heart Rate in bpm (found in the gold square in the figure) on the lower Heart Rate Screen and the Time Between Beats found under T2-T1 (Red Circle) on the Pulse Screen (Analysis Figure 3, above).
- Now move the cursor from the first wave to the peak of the third wave, so now you have a cursor remaining on the second wave and a cursor on the third wave, record the same values for this set of data.
- Next, move the cursor from the second wave to the fourth wave, record the data. Continue moving the cursors in this manner until you have recorded data for ten waves.
- Calculate the mean for the 10 waves on your lab report and answer the questions. You’re all done with iWorx for this week!