Medicine LibreTexts

6.3: Oriented Edge Detectors in Primary Visual Cortex

  • Page ID
    12598
    \( \newcommand{\vecs}[1]{\overset { \scriptstyle \rightharpoonup} {\mathbf{#1}} } \) \( \newcommand{\vecd}[1]{\overset{-\!-\!\rightharpoonup}{\vphantom{a}\smash {#1}}} \)\(\newcommand{\id}{\mathrm{id}}\) \( \newcommand{\Span}{\mathrm{span}}\) \( \newcommand{\kernel}{\mathrm{null}\,}\) \( \newcommand{\range}{\mathrm{range}\,}\) \( \newcommand{\RealPart}{\mathrm{Re}}\) \( \newcommand{\ImaginaryPart}{\mathrm{Im}}\) \( \newcommand{\Argument}{\mathrm{Arg}}\) \( \newcommand{\norm}[1]{\| #1 \|}\) \( \newcommand{\inner}[2]{\langle #1, #2 \rangle}\) \( \newcommand{\Span}{\mathrm{span}}\) \(\newcommand{\id}{\mathrm{id}}\) \( \newcommand{\Span}{\mathrm{span}}\) \( \newcommand{\kernel}{\mathrm{null}\,}\) \( \newcommand{\range}{\mathrm{range}\,}\) \( \newcommand{\RealPart}{\mathrm{Re}}\) \( \newcommand{\ImaginaryPart}{\mathrm{Im}}\) \( \newcommand{\Argument}{\mathrm{Arg}}\) \( \newcommand{\norm}[1]{\| #1 \|}\) \( \newcommand{\inner}[2]{\langle #1, #2 \rangle}\) \( \newcommand{\Span}{\mathrm{span}}\)\(\newcommand{\AA}{\unicode[.8,0]{x212B}}\)

    fig_v1_orientation_tuning_data.jpg
    Figure 6.7: Orientation tuning of an individual V1 neuron in response to bar stimuli at different orientations -- this neuron shows a preference for vertically oriented stimuli.

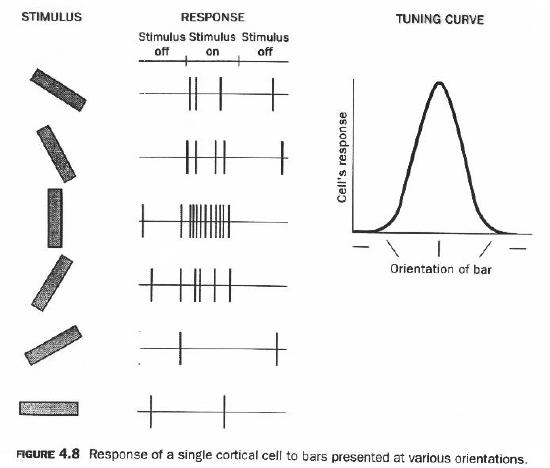
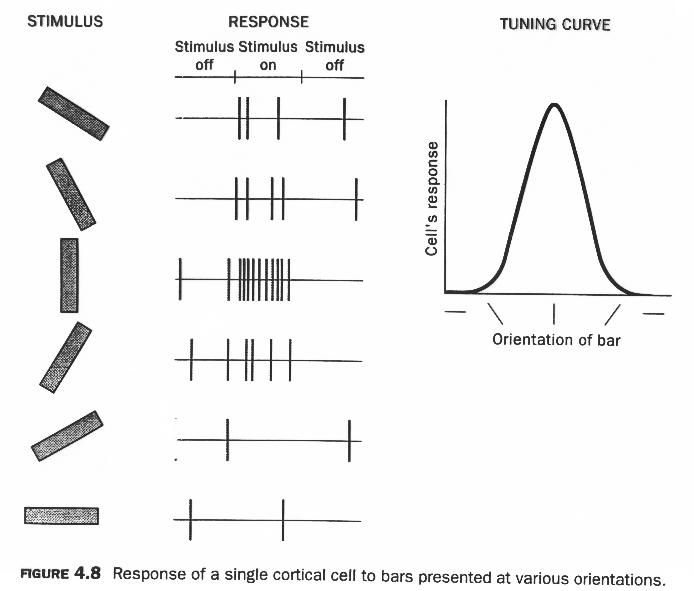
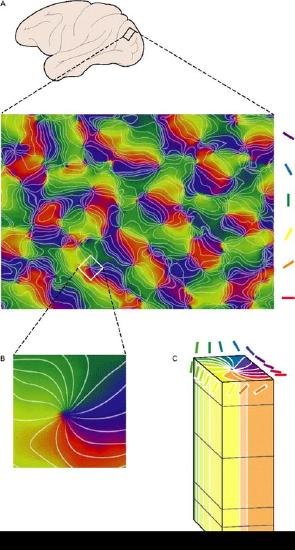
    Neurons in primary visual cortex (V1) detect the orientation of edges or bars of light within their receptive field (RF -- the region of the visual field that a given neuron receives input from). Figure 6.7 shows characteristic data from electrophysiological recordings of an individual V1 neuron in response to oriented bars. This neuron responds maximally to the vertical orientation, with a graded fall off on either side of that. This is a very typical form of tuning curve. Figure 6.8 shows that these orientation tuned neurons are organized topographically, such that neighbors tend to encode similar orientations, and the orientation tuning varies fairly continuously over the surface of the cortex.

    481px-fig_v1_orientation_cols_data.jpg
    Figure \(6.8\): Topographic organization of oriented edge detectors in V1 -- neighboring regions of neurons have similar orientation tuning, as shown in this colorized map where different colors indicate orientation preference as shown in panel C. Panel B shows how a full 360 degree loop of orientations nucleate around a central point -- these are known as pinwheel structures.

    The question we attempt to address in this section is why such a topographical organization of oriented edge detectors would exist in primary visual cortex? There are multiple levels of answer to this question. At the most abstract level, these oriented edges are the basic constituents of the kinds of images that typically fall on our retinas. These are the most obvious statistical regularities of natural images (cite: Olshausen & Field, xx). If this is indeed the case, then we would expect that the self-organizing aspect of the XCAL learning algorithm used in our models (as discussed in the Learning Chapter) would naturally extract these statistical regularities, providing another level of explanation: V1 represents oriented edge detectors because this is what the learning mechanisms will naturally develop.

    The situation here is essentially equivalent to the self organizing learning model explored in the Learning Chapter, which was exposed to horizontal and vertical lines, and learned to represent these strong statistical regularities in the environment.

    However, that earlier simulation did nothing to address the topography of the V1 neurons -- why do neighbors tend to encode similar information? The answer we explore in the following simulation is that neighborhood-level connectivity can cause nearby neurons to tend to activate together, and because activity drives learning, this then causes them to tend to learn similar things.

    Simulation Exploration

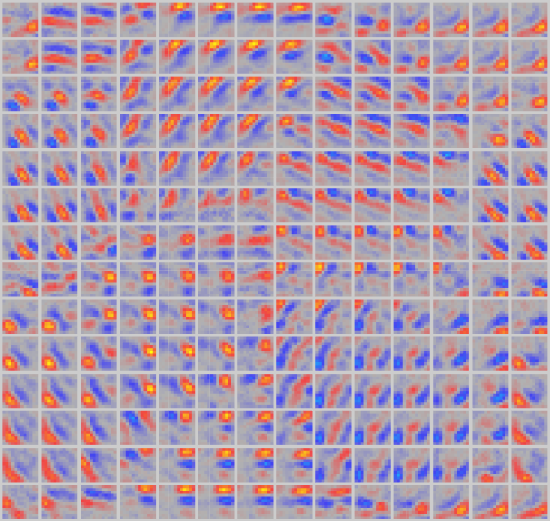
    Open V1Rf to explore the development of oriented edge detectors in V1. This model gets exposed to a set of natural images, and learns to encode oriented edges, because they are the statistical regularity present in these images. Figure 6.9 shows the resulting map of orientations that develops.

    fig_v1rf_map.png
    Figure \(6.9\): Topographic organization of oriented edge detectors in simulation of V1 neurons exposed to small windows of natural images (mountains, trees, etc). The neighborhood connectivity of neurons causes a topographic organization to develop.

    This page titled 6.3: Oriented Edge Detectors in Primary Visual Cortex is shared under a CC BY-SA 3.0 license and was authored, remixed, and/or curated by O'Reilly, Munakata, Hazy & Frank via source content that was edited to the style and standards of the LibreTexts platform; a detailed edit history is available upon request.


    This page titled 6.3: Oriented Edge Detectors in Primary Visual Cortex is shared under a CC BY-SA 3.0 license and was authored, remixed, and/or curated by R. C. O'Reilly, Y. Munakata, M. J. Frank, T. E. Hazy, & Contributors via source content that was edited to the style and standards of the LibreTexts platform; a detailed edit history is available upon request.