
9.3: Indicators of Health- BMI, Body Composition, and Metabolic Health
- Page ID
- 43948

Determining Your Healthy Size
There are many metrics used to assess body composition (and we’ll discuss some of these later), but none give a complete picture of an individual’s health. That requires a truly individual assessment, not just of numbers on the scale, but of a person’s overall health and well-being in the context of family history and lifestyle.
Here’s how the authors of the text, “Sport Nutrition for Health and Performance” describe a healthy body weight:
- A weight that is appropriate for your age and physical development
- A weight you can achieve and sustain without severely curtailing your food intake and constantly dieting
- A weight that is compatible with normal blood pressure, lipid levels, and glucose tolerance (in other words, you are metabolically fit)
- A weight that is based on your genetic background and family history of body shape and weight (after all the apple doesn’t fall too far from the tree)
- A weight that promotes good eating habits and allows you to participate in regular physical activity
- A weight that is acceptable to you
Overall, a healthy size should not be dictated by a formula, the latest fad, or societal expectations. People come in all shapes and sizes, and you have to determine what a healthy size is for you. Yet it’s also worth understanding some of the measures used to estimate body composition, how they can be linked to health, and their limitations.

Body Mass Index
Body Mass Index (BMI) is an inexpensive screening tool used in clinical and research settings to assess body weight relative to height. Because it takes height into account, it is more predictive of how much body fat a person has than weight alone. However, BMI is not a direct measure of body fat, so it shouldn’t be used on its own to diagnose obesity or the health of an individual.1
BMI calculations and categories
BMI is calculated using the following equations:
BMI = [weight (kg)/height (m2)]
OR
BMI = [weight (lb)/height (in2)] x 703
The Centers for Disease Control and Prevention has a BMI calculator on its website: https://www.cdc.gov/healthyweight/assessing/bmi/adult_bmi/english_bmi_calculator/bmi_calculator.html
For adults, BMI ranges are divided into four categories, which are associated with different levels of health risk:
- Underweight – BMI < 18.5
- Normal weight – BMI from 18.5-24.9
- Overweight – BMI from 25-29.9
- Obese – BMI from 30 or higher
Obesity is frequently subdivided into categories:
- Class 1 obesity: BMI of 30 to < 35
- Class 2 obesity: BMI of 35 to < 40
- Class 3 obesity: BMI of 40 or higher
(BMI values are interpreted differently for children, because body fatness changes with age and can be different between boys and girls.)
In general, BMI in the “normal” range is associated with better health compared to both underweight and overweight or obese values, because there are risks of carrying both too little and too much body fat. When researchers have looked at BMI and health in large groups of people, they generally find that the lowest risk of disease and of dying younger is in the range of BMI of 20 to 25. As BMI values increase into the overweight and obese ranges, the risk of developing type 2 diabetes, cardiovascular disease and stroke, and even cancer increase, as well as other complications of obesity, such as osteoarthritis.2,3,4 Carrying extra weight not only puts a mechanical strain on the body, but it also negatively impacts metabolic health and increases inflammation.5
Limitations of BMI
The advantage of BMI is that it’s simple and easy to calculate, but it also has several important limitations. Since it’s only based on weight and height, it doesn’t distinguish between muscle mass and adipose tissue. It’s not unusual for muscular athletes to be classified as overweight based on BMI, but this can be misleading, because they may have little to no excess body fat. On the flipside, BMI can underestimate body fatness in someone with very low muscle mass, such as a person who is elderly and frail. In addition, BMI can’t tell us where body fat is located in the body, and as we’ll learn, this is a major factor determining its impact on health.
All of this means that BMI is not particularly useful for comparing one individual to another individual or even one population to another, because this one number simply doesn’t account for all of the underlying diversity in factors like body type, muscle mass, biological sex, and race. And for an individual, one BMI measurement at a single point in time may not be all that meaningful—other measurements and clinical assessments are needed to diagnose obesity and more accurately assess disease risk, as we’ll discuss in a moment.
BMI is perhaps most useful for tracking changes in body composition over time, whether of a population or an individual. For example, the data on average BMI in the U.S. show a clear increase over the last several decades, and the most likely explanation for that is not that people in the U.S. are all gaining several pounds of muscle each year, but that we’re putting on more fat. On the other hand, someone may have a BMI classified as overweight, but if they’ve been at that BMI their entire adult life and are active and metabolically healthy, that may just be the natural size and shape of their body.
Measuring Body Composition
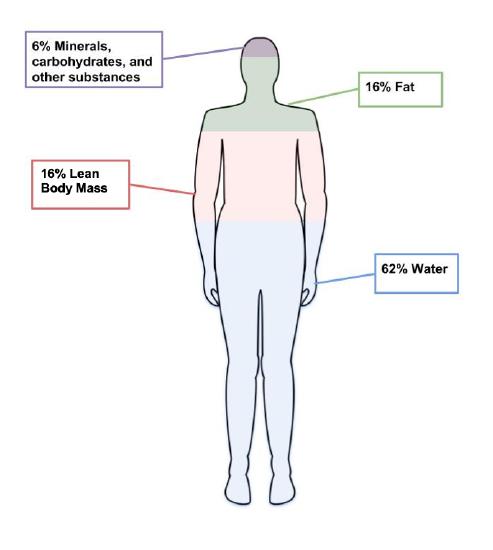
A person’s body mass is made up of water, lean body mass (including organs, bone, and muscle), fat, and other components like minerals. The weight on the scale does not distinguish between these different components, but body composition measurements can.
Body composition measurements are used by individuals and researchers to determine how much of a person’s weight is made up of body fat and lean body mass. An individual might use body composition measurements to track their progress in building muscle with a new strength training program. Since increased body fat is often a risk factor for diseases like cardiovascular diseases and diabetes, researchers are often interested in this type of data. There are several different methods used to measure body composition, each with advantages and limitations.6
- Skinfold test. This is a simple, non-invasive, and low-cost way to assess fat mass. Calipers are used to measure the thickness of skin on three to seven different parts of the body, and these numbers are then entered into a conversion equation. Keep in mind that the accuracy of the skinfold test depends on the skill of the person taking the measurements, the accuracy of the calipers, and the appropriateness of the conversion equations. Best practice is for the same person to take repeated measurements if using them to monitor changes over time. Repeated measurements by different technicians, using different calipers, and different conversion equations will yield very different results.

- Bioelectric Impedance Analysis (BIA). This is a simple, non-invasive, quick tool that does not require extensive training. BIA estimates body composition by sending a small amount of electricity through the body. Since water is a good conductor of electricity, and lean body mass contains more water than fat, the rate at which the current travels can be used to estimate percent body fat. Body fluid levels must be normal with BIA, which is a limitation, since hydration can be impacted by exercise, alcohol, and menstrual cycles.

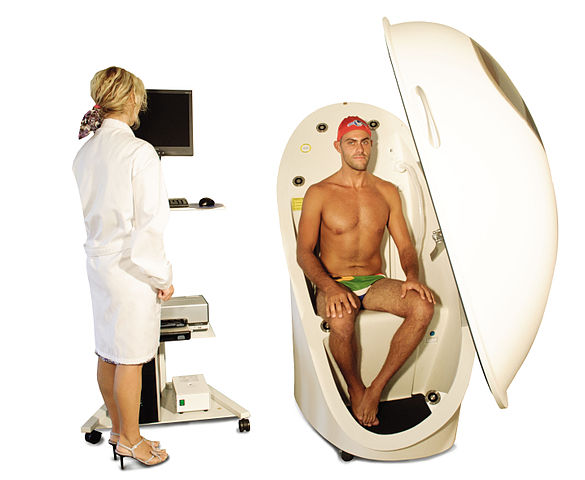
- Air displacement plethysmography (ADP) – This is a non-invasive, quick tool that does not take extensive training. It’s more accurate but also more expensive than BIA. While a person sits inside an enclosed chamber (usually called a Bod Pod), changes in air pressure are used to determine the amount of air that is displaced in the test chamber, which can determine body volume. These measurements are then translated into percent body fat. Hydration status can affect the accuracy of this test. This test also needs to be conducted in a facility with a Bod Pod, so it is not as accessible as the skinfold test or the BIA.
- Dual-energy X-ray absorptiometry (DXA). This method directs two low-dose X-ray beams through the body and determines the amount of energy absorbed from the beams. The amount of energy absorbed is dependent on the body’s content of bone, lean tissue mass, and fat mass. Using standard mathematical formulas, fat content and bone density can be accurately estimated. Although this is one of the most accurate methods of measuring fat mass, it is expensive and mostly used in research. It also requires low doses of radiation to the subject being tested, and is not appropriate for pregnant women.

Keep in mind that body composition can be hard to measure accurately when using inexpensive and accessible techniques like skinfold testing and BIA. Your best bet is to pick one method and use that method over time to compare numbers and see how they change. Just don’t get too hung up on the actual number, as the accuracy will be questionable depending on the method chosen.
Measuring Fat Distribution
Total body fat is one predictor of health; another is how the fat is distributed in the body. The location of fat is important, because people who store fat more centrally (apple-shaped) have a higher risk for chronic disease—like cardiovascular disease and type 2 diabetes—compared to people who store fat in the hips, thighs, and buttocks (pear-shaped). This is because visceral fat that surrounds vital organs (common in central obesity or apple-shaped fat patterning) is more metabolically active, releasing more hormones and inflammatory factors thought to contribute to disease risk compared to subcutaneous fat. Subcutaneous fat stored just below the skin (common in pear-shaped fat patterning) does not seem to significantly increase the risk for chronic disease.

Body fat distribution can be measured by waist circumference and waist-to-hip ratio, both of which only require a measuring tape.
- Waist circumference is measured just above the hip bone, level with your belly button. Men with a waist circumference greater than 40 inches and women with a waist circumference greater than 35 inches are predicted to face greater health risks.
- Waist-to-hip ratio is calculated by measuring waist circumference and hip circumference (at its widest part) and dividing the two values. Abdominal obesity is defined by the World Health Organization as a waist-to-hip ratio above 0.90 for males and above 0.85 for females.
Indicators of Metabolic Health
Metabolic health refers to the body’s ability to maintain normal homeostasis and effectively regulate measures like blood pressure, blood lipids, and blood glucose. It is assumed that when an individual is classified as overweight and obese, based on measurements of BMI and body fat composition and distribution, metabolic health is negatively impacted. However, some individuals that meet the criteria for obesity do not experience an increased risk of metabolic health.7 These individuals are known as “metabolically healthy obese” (MHO). Metabolically healthy can be described as an absence of insulin resistance, type 2 diabetes, dyslipidemia, and hypertension.
In contrast, there are also individuals who are classified as a healthy weight (BMI < 25) but show an increased metabolic risk. These individuals are known as metabolically obese normal weight (MONW).
These variations challenge the assumptions we hold about body fatness. It can not always be assumed that thinness equals healthy, and fatness equals unhealthy.
References:
- Manore, M.M., Meyer, N.L., & Thompson, J.L. (2009). Sport Nutrition for Health and Performance, 2nd ed. Champagn, IL: Human Kinetics.
- NBHLI. (2013). Managing Overweight and Obesity in Adults: Systematic Evidence Review from the Obesity Expert Panel. Retrieved October 27, 2019 from https://www.nhlbi.nih.gov/health-topics/managing-overweight-obesity-in-adults
- 1Centers for Disease Control and Prevention. (2019, March 1). About Adult BMI | Healthy Weight | CDC. Retrieved October 27, 2019, from https://www.cdc.gov/healthyweight/assessing/bmi/adult_bmi/index.html
- 2Aune, D., Sen, A., Prasad, M., Norat, T., Janszky, I., Tonstad, S., … Vatten, L. J. (2016). BMI and all cause mortality: Systematic review and non-linear dose-response meta-analysis of 230 cohort studies with 3.74 million deaths among 30.3 million participants. The BMJ, 353. doi.org/10.1136/bmj.i2156
- 3Bhaskaran, K., dos-Santos-Silva, I., Leon, D. A., Douglas, I. J., & Smeeth, L. (2018). Association of BMI with overall and cause-specific mortality: A population-based cohort study of 3·6 million adults in the UK. The Lancet. Diabetes & Endocrinology, 6(12), 944–953. https://doi.org/10.1016/S2213-8587(18)30288-2
- 4The Global BMI Mortality Collaboration. (2016). Body-mass index and all-cause mortality: Individual-participant-data meta-analysis of 239 prospective studies in four continents. Lancet, 388(10046), 776–786.
- 5Greenberg, A.S., & Obin, M.S. (2006). Obesity and the role of adipose tissue in inflammation and metabolism. American Journal of Clinical Nutrition, 83(2): 461S-465S. DOI: 10.1093/ajcn/83.2.461S
- 6Lemos, T., & Gallagher, D.( 2017). Current body composition measurement techniques. Current Opinion in Endocrinology & Diabetes and Obesity, 24(5), 310–314. doi: 10.1097/MED.0000000000000360
- 7Matthew, H., Farr, O.M., & Mantzoros, S.C. (2016). Metabolic Health and Weight: Understanding metabolically unhealthy normal weight or metabolically healthy obese patients. Metabolism, 65(1), 73-80. doi: 10.1016/j.metabol.2015.10.019