
6.2: Carbohydrate Metabolism
- Page ID
- 20997

There are many metabolic pathways/cycles/processes/reactions that are involved in the synthesis or degradation of carbohydrates and compounds formed from them. Please note that most of these pathways are not specific to carbohydrates only. Gluconeogenesis will be learned about in the protein section, because amino acids are a common substrate used for synthesizing glucose.
Carbohydrate Pathways/Cycles/Processes/Reactions
Glycogenesis
glycogen synthesis
Glycogenolysis
glycogen breakdown
Gluconeogenesis
synthesis of glucose from a non-carbohydrate source
Glycolysis
breakdown of glucose to pyruvate
Transition Reaction
conversion of pyruvate to acetyl-\(\ce{CoA}\)
Citric Acid (Tricarboxylic acid (TCA), Kreb's) Cycle
acetyl-\(\ce{CoA}\) combines with oxaloacetate to form citrate; ATP, \(\ce{NADH}\), and \(\ce{FADH2}\) are produced in the cycle
Electron Transport Chain
oxidative phosphorylation, producing ATP from \(\ce{NADH}\) and \(\ce{FADH2}\)
Monosaccharide Metabolism
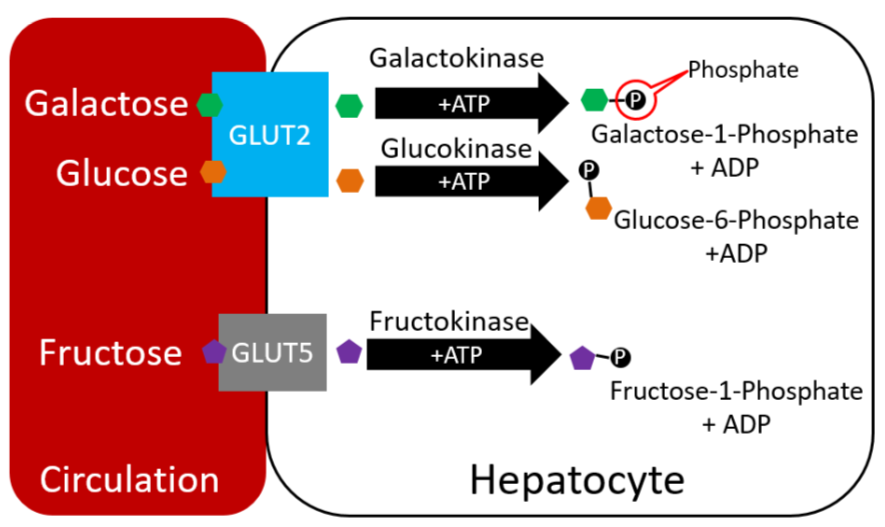
Galactose and fructose metabolism is a logical place to begin looking at carbohydrate metabolism, before shifting focus to the preferred monosaccharide glucose. The figure below reminds you that in the liver, galactose and fructose have been phosphorylated.
Galactose
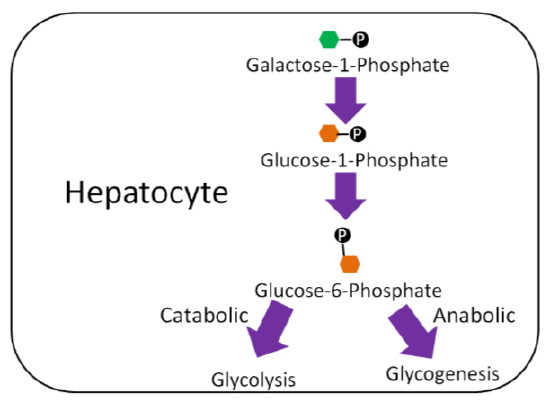
In the liver, galactose-1-phosphate is converted to glucose-1-phosphate, before finally being converted to glucose-6-phosphate1. As shown below, glucose 6-phosphate can then be used in either glycolysis or glycogenesis, depending on the person's current energy state.
Fructose
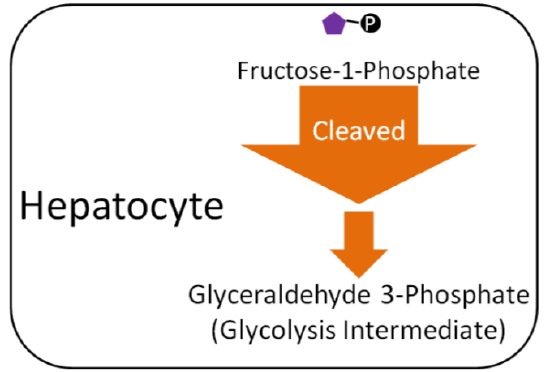
Unlike galactose, fructose cannot be used to form phosphorylated glucose. Instead, fructose-1-phosphate is cleaved in the liver to form glyceraldehyde 3-phosphate (glycolysis intermediate, you will learn more about below). This occurs through multiple steps, as depicted below.
Glucose-6-Phosphate
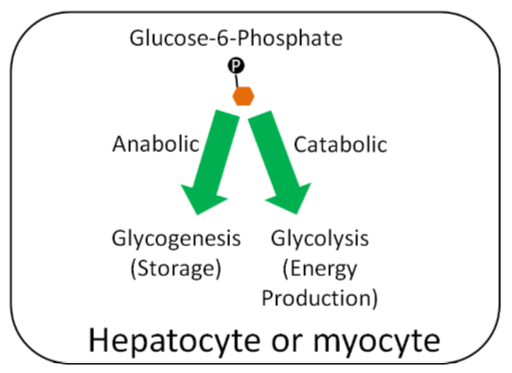
Within hepatocytes or myocytes (muscle cells), glucose-6-phosphate can be used either for glycogenesis (glycogen synthesis) or glycolysis (breakdown of glucose for energy production). If the person is in an anabolic state, they will use glucose-6-phosphate for storage. If they are in a catabolic state, they will use it for energy production. In an anabolic state, glucose-6-phosphate will be used for glycogen synthesis for storage. In catabolic state, it will be used for energy production.
Glycogenesis & Glycogenolysis
As discussed earlier, glycogen is the animal storage form of glucose. If a person is in an anabolic state, such as after consuming a meal, most glucose-6-phosphate within the myocytes (muscle cells) or hepatocytes (liver cells) is going to be stored as glycogen. The structure is shown below as a reminder.
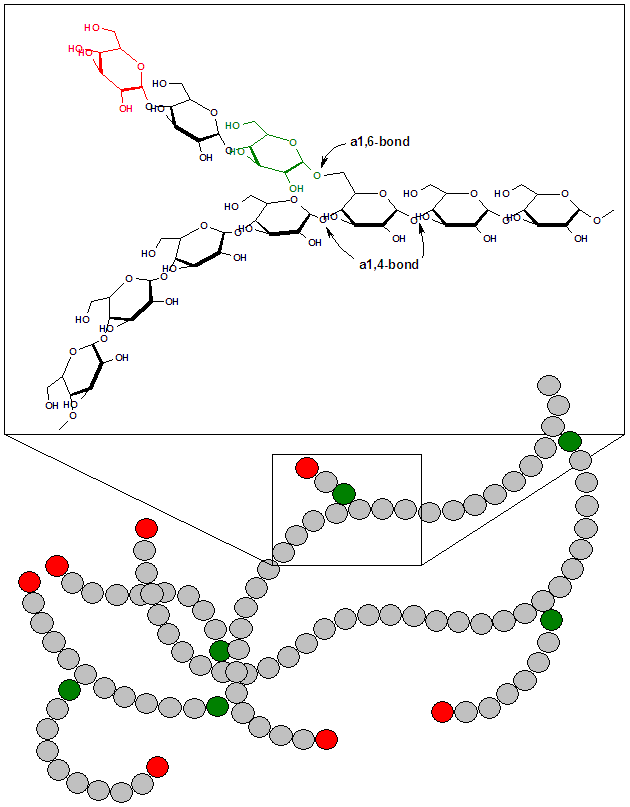
Glycogen is mainly stored in the liver and the muscle. It makes up ~6% of the wet weight of the liver and only 1% of muscle wet weight. However, since we have far more muscle mass in our body, there is 3-4 times more glycogen stored in muscle than in the liver3. We have limited glycogen storage capacity. Thus, after a high-carbohydrate meal, our glycogen stores will reach capacity. After glycogen stores are filled, glucose will have to be metabolized in different ways for it to be stored in a different form.
Glycogenesis
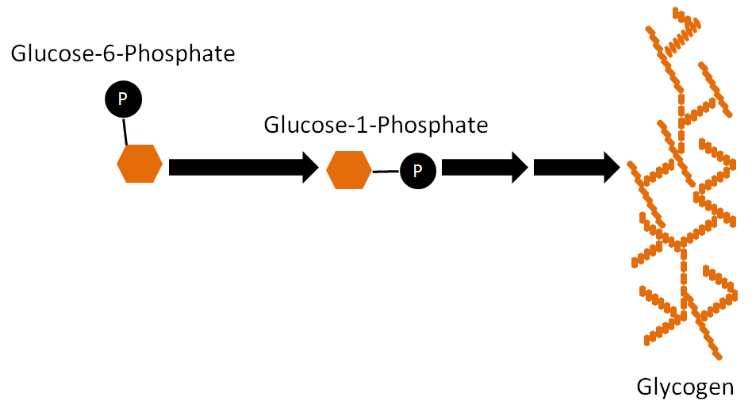
The synthesis of glycogen from glucose is a process known as glycogenesis. Glucose-6-phosphate is not inserted directly into glycogen in this process. There are a couple of steps before it is incorporated. First, glucose-6-phosphate is converted to glucose-1-phosphate and then converted to uridine diphosphate (UDP)-glucose. UDP-glucose is inserted into glycogen by either the enzyme, glycogen synthase (alpha-1,4 bonds), or the branching enzyme (alpha-1,6 bonds) at the branch points1.
Glycogenolysis
The process of liberating glucose from glycogen is known as glycogenolysis. This process is essentially the opposite of glycogenesis with two exceptions:
- There is no UDP-glucose step, and
- A different enzyme, glycogen phosphorylase, is involved.
Glucose-1-phosphate is cleaved from glycogen by the enzyme, glycogen phosphorylase, which then can be converted to glucose-6-phosphate as shown below1.

Glycolysis
If a person is in a catabolic state or in need of energy, such as during fasting, most glucose-6-phosphate will be used for glycolysis.
Glycolysis is the breaking down of one glucose molecule (6 carbons) into two pyruvate molecules (3 carbons). During the process, a net of two ATPs and two \(\ce{NADH}\)s are also produced.

3 steps of Glycolysis
- Energy investment step - 2 ATP are added to the 6 carbon molecule.
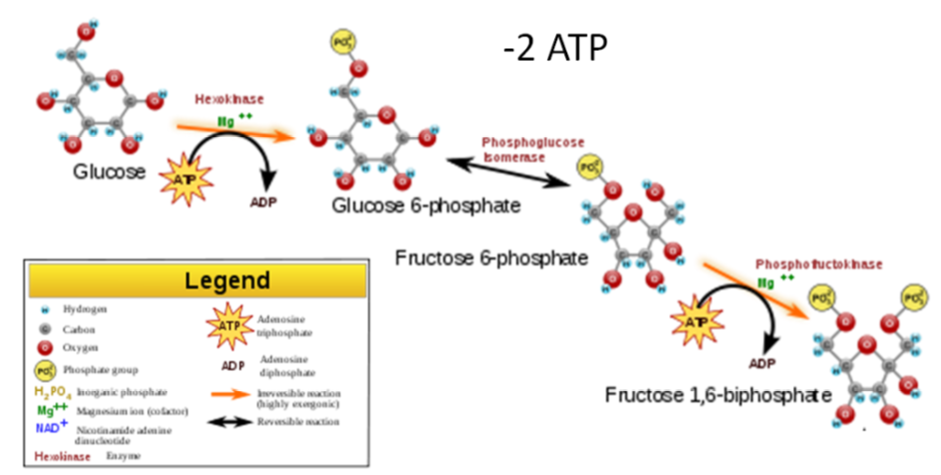
- Split Glucose - The 6 carbon molecule is split into two 3 carbon molecules.
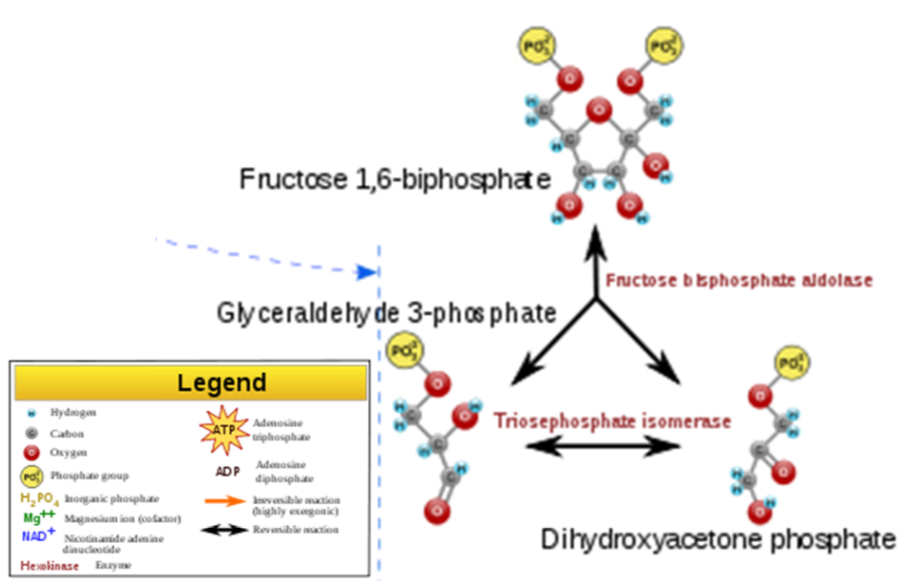
- Energy harvesting step - 1 \(\ce{NADH}\) and 2 ATPs are produced from each 3 carbon molecule (there are two 3 carbon molecules formed from each glucose). One is glyceraldehyde 3-phosphate, which is the intermediate that fructose is metabolized to. So this is where fructose metabolism merges with how glucose and galactose have been metabolized. There are some metabolic regulatory steps that it skips, which is part of the reason for the concern with fructose intake.

Thus, from a molecule of glucose, the harvesting step produces a total of four ATPs and two \(\ce{NADH}\)s. Subtracting the harvesting from the investment step, the net output from one molecule of glucose is two ATPs and two \(\ce{NADH}\)s.
The figure below shows the stages of glycolysis, as well as the transition reaction, citric acid cycle, and electron transport chain that are utilized by cells to produce energy.
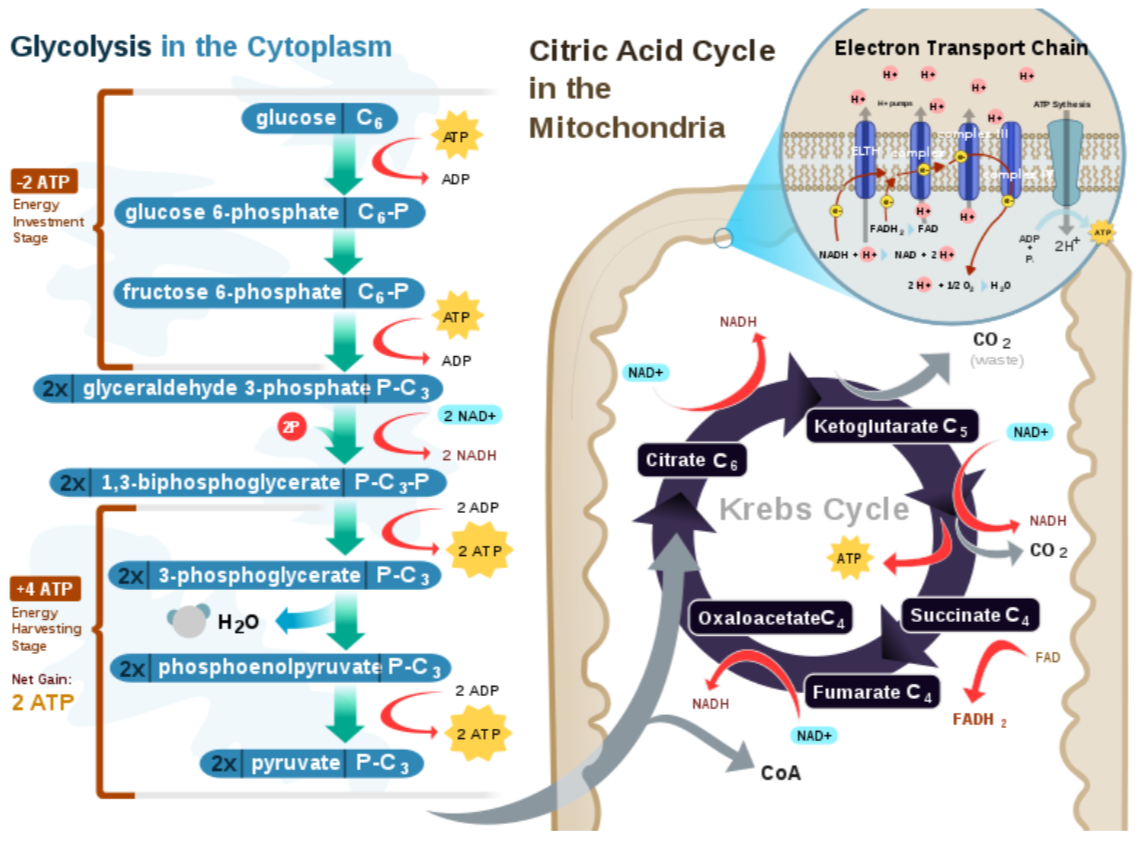
Transition Reaction
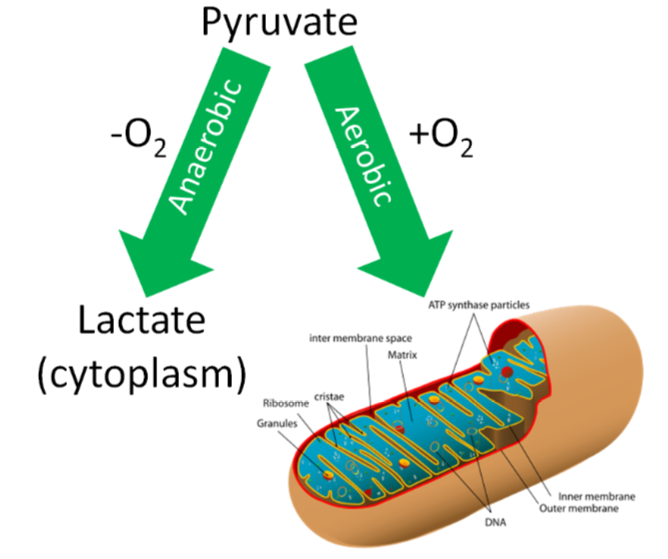
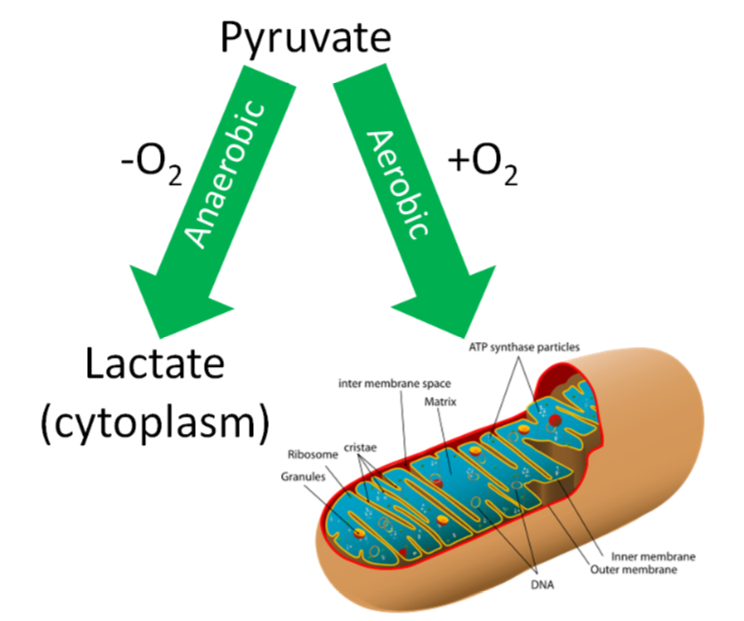
If a person is in a catabolic state, or needs energy, how pyruvate will be used depends on whether adequate oxygen levels are present. If there are adequate oxygen levels (aerobic conditions), pyruvate moves from the cytoplasm, into the mitochondria, and then undergoes the transition reaction. If there are not adequate oxygen levels (anaerobic conditions), pyruvate will instead be used to produce lactate in the cytoplasm. We are going to focus on the aerobic pathway to begin with, then we will address what happens under anaerobic conditions later.
The transition reaction is the transition between glycolysis and the citric acid cycle. The transition reaction converts pyruvate (3 carbons) to acetyl \(\ce{CoA}\) (2 carbons), producing carbon dioxide (\(\ce{CO2}\)) and an \(\ce{NADH}\) as shown below. The figure below shows the transition reaction with \(\ce{CoA}\) and \(\ce{NAD}\) entering, and acetyl-\(\ce{CoA}\), \(\ce{CO2}\), and \(\ce{NADH}\) being produced.
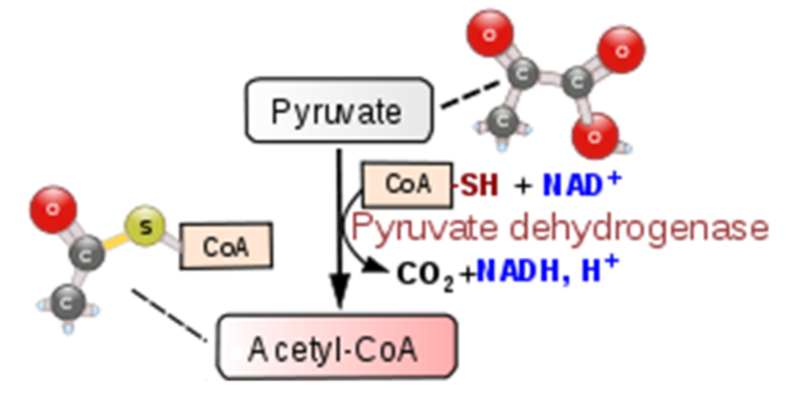
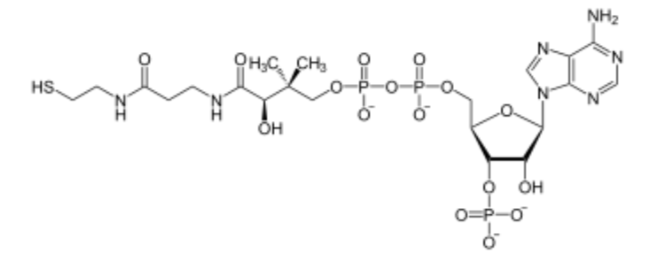
The acetyl is combined with coenzyme A (\(\ce{CoA}\)) to form acetyl-\(\ce{CoA}\). The structure of \(\ce{CoA}\) is shown below.
Thus, for one molecule of glucose, the transition reaction produces 2 acetyl-\(\ce{CoA}\)s, 2 molecules of \(\ce{CO2}\), and 2 \(\ce{NADH}\)s.
The Citric Acid Cycle
Acetyl-\(\ce{CoA}\) is a central point in metabolism, meaning there are a number of ways that it can be used. We are going to continue to consider its use in an aerobic, catabolic state (need energy). Under these conditions, acetyl-\(\ce{CoA}\) will enter the citric acid cycle (aka Krebs Cycle, TCA Cycle). The following figure shows the citric acid cycle.

The citric acid cycle begins by acetyl-\(\ce{CoA}\) (2 carbons) combining with oxaloacetate (4 carbons) to form citrate (aka citric acid, 6 carbons). A series of transformations occur before a carbon is given off as carbon dioxide and \(\ce{NADH}\) is produced. This leaves alpha-ketoglutarate (5 carbons). Another carbon is given off as \(\ce{CO2}\) to form succinyl \(\ce{CoA}\) (4 carbons) and produce another NADH. In the next step, one guanosine triphosphate (GTP) is produced as succinyl-\(\ce{CoA}\) is converted to succinate. GTP is readily converted to ATP, thus this step is essentially the generation of 1 ATP. In the next step, an \(\ce{FADH2}\) is produced along with fumarate. Then, after more steps, another \(\ce{NADH}\) is produced as oxaloacetate is regenerated.
Thus, the net output from one cycle is:
2 \(\ce{CO2}\)
3 \(\ce{NADH}\)
1 \(\ce{FADH2}\)
1 GTP (converted to ATP)
The two carbons that are given off as \(\ce{CO2}\) originally came from acetyl-\(\ce{CoA}\).
The first video does a good job of explaining and illustrating how the cycle works. The second video is an entertaining rap about the cycle.
There are two acetyl-\(\ce{CoA}\)s produced from one glucose, so the net from one glucose is the amount generated from two cycles:
4 \(\ce{CO2}\)
6 \(\ce{NADH}\)
2 \(\ce{FADH2}\)
2 GTP (converted to ATP)
Through glycolysis, the transition reaction, and the citric acid cycle, multiple \(\ce{NADH}\) and \(\ce{FADH2}\) molecules are produced. Under aerobic conditions, these molecules will enter the electron transport chain to be used to generate energy through oxidative phosphorylation as described in the next section.
Electron Transport Chain
The electron transport chain is located on the inner membrane of mitochondria. The electron transport chain contains a number of electron carriers. These carriers take the electrons from \(\ce{NADH}\) and \(\ce{FADH2}\), pass them down the chain of complexes and electron carriers, and ultimately produce ATP. More specifically, the electron transport chain takes the energy from the electrons on \(\ce{NADH}\) and \(\ce{FADH2}\) to pump protons (\(\ce{H+}\)) into the intermembrane space. This creates a proton gradient between the intermembrane space (high) and the matrix (low) of the mitochondria. ATP synthase uses the energy from this gradient to synthesize ATP. Oxygen is required for this process because it serves as the final electron acceptor, forming water. Collectively this process is known as oxidative phosphorylation. The following figure does a nice job of illustrating how the electron transport chain functions.

\(2.5 \ce{ATP}/\ce{NADH}\) and \(1.5 \ce{ATP}/\ce{FADH2}\) are produced in the electron transport chain. Some resources will say \(3 \ce{ATP}/\ce{NADH}\) and \(2 \ce{ATP}/\ce{FADH2}\), but these values are generally less accepted now.
For one molecule of glucose, the preceding pathways produce:
\[\begin{array}{cc} \\ \text{Glycolysis: }&2\ce{NADH}\\ \text{Transition Reaction: }&2 \ce{NADH}\\ \text{Citric Acid Cycle: }&6 \ce{NADH}, 2 \ce{FADH2}\\ \hline \text{Total: }&10 \ce{NADH}, 2 \ce{FADH2}\\ \end{array} \nonumber \]
Multiply that by the amount of ATP per \(\ce{NADH}\) or \(\ce{FADH2}\) to yield:
\[\begin{align*} \dfrac{10 \ce{NADH} \times 2.5 \ce{ATP}}{\ce{NADH}} &= 25 \ce{ATP} \\[4pt] \dfrac{2 \ce{FADH2} \times 1.5 \ce{ATP}}{\ce{FADH2}} &= 3 \ce{ATP} \\[4pt] \ce{Total} &= 28 \ce{ATP} \end{align*}\]
The first video does a nice job of illustrating and reviewing the electron transport chain. Note that it uses 3 ATP/\(\ce{NADH}\) and 2 ATP/\(\ce{FADH2}\) so the totals from each cycle are different from those listed above. The second video is a great rap video explaining the steps of glucose oxidation.
Aerobic Glucose Metabolism Totals
The table below shows the ATP generated from one molecule of glucose in the different metabolic pathways.
| Metabolic Pathway | ATP Generated |
|---|---|
| Glycolysis | 2 |
| Citric Acid Cycle | 2 |
| Electron Transport Chain | 28 |
| Total | 32 |
Notice that the vast majority of ATP is generated by the electron transport chain. If we do the math, 28/32 X 100 = 87.5% of the ATP from a molecule of glucose is generated by the electron transport chain. Remember that this is aerobic and requires oxygen to be the final electron acceptor. If 3 ATP/\(\ce{NADH}\) and 2 ATP/\(\ce{FADH2}\) are used instead of 2.5 ATP/\(\ce{NADH}\) and 1.5 ATP/\(\ce{FADH2}\) that were used above, total ATP and percentage of ATP produced by the electron transport chain would be different. But the takeaway message remains the same. The electron transport chain by far produces the most ATP from one molecule of glucose.
Anaerobic Respiration
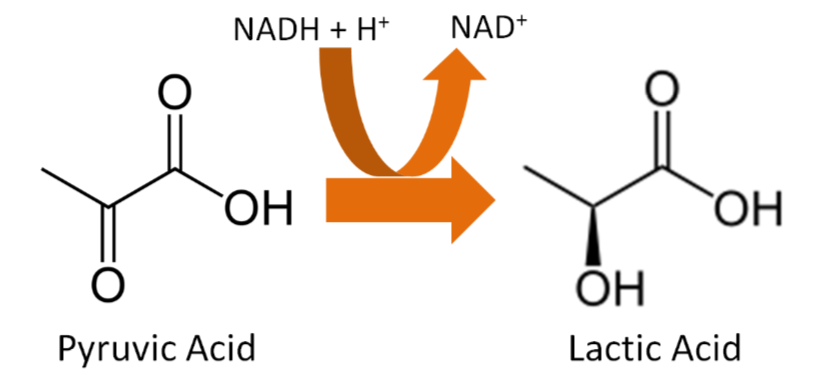
Conditions without oxygen are referred to as anaerobic. In this case, the pyruvate will be converted to lactate in the cytoplasm of the cell as shown below.
What happens if oxygen is not available to serve as the final electron acceptor? As shown in the following video, the ETC becomes backed up with electrons and cannot accept them from \(\ce{NADH}\) and \(\ce{FADH2}\).
This leads to a problem in glycolysis because \(\ce{NAD}\) is needed to accept electrons, as shown below. Without the electron transport chain functioning, all \(\ce{NAD}\) has been reduced to \(\ce{NADH}\) and glycolysis cannot continue to produce ATP from glucose.

Thus, there is a workaround to regenerate \(\ce{NAD}\) by converting pyruvate (pyruvic acid) to lactate (lactic acid) as shown below.
However, anaerobic respiration only produces 2 ATP per molecule of glucose, compared to 32 ATP for aerobic respiration. The biggest producer of lactate is the muscle. Through what is known as the Cori cycle, lactate produced in the muscle can be sent to the liver. In the liver, through a process known as gluconeogenesis, glucose can be regenerated and sent back to the muscle to be used again for anaerobic respiration forming a cycle as shown below.
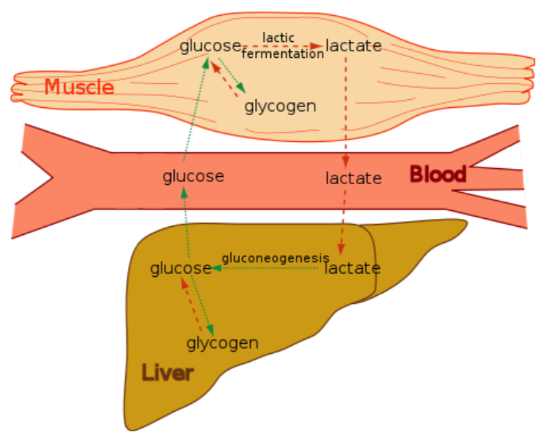
It is worth noting that the Cori cycle also functions during times of limited glucose (like fasting) to spare glucose by not completely oxidizing it. By spare it means maintain its carbons so they can potentially be used to synthesize glucose.
References
- Gropper SS, Smith JL, Groff JL. (2008) Advanced nutrition and human metabolism. Belmont, CA: Wadsworth Publishing.
- en.Wikipedia.org/wiki/File:Glycogen.png
- Shils ME, Shike M, Ross AC, Caballero B, Cousins RJ, editors. (2006) Modern nutrition in health and disease. Baltimore, MD: Lippincott Williams & Wilkins.
- Gropper SS, Smith JL, Groff JL. (2008) Advanced nutrition and human metabolism. Belmont, CA: Wadsworth Publishing.
- en.Wikipedia.org/wiki/File:Glycolysis.svg
- en.Wikipedia.org/wiki/File:CellRespiration.svg
- simple.Wikipedia.org/wiki/Mi..._en_(edit).svg
- en.Wikipedia.org/wiki/Image:C...conitate_2.svg
- en.Wikipedia.org/wiki/Image:Coenzym_A.svg
- en.Wikipedia.org/wiki/File:Mi...%80%94Etc4.svg
- en.Wikipedia.org/wiki/File:CellRespiration.svg
- en.Wikipedia.org/wiki/Pyruvi...D-skeletal.png
- en.Wikipedia.org/wiki/Lactic...d-skeletal.svg
- commons.wikimedia.org/wiki/F...iCycle-eng.svg