
4.5: Glycemic Response, Insulin, and Glucagon
- Page ID
- 20986

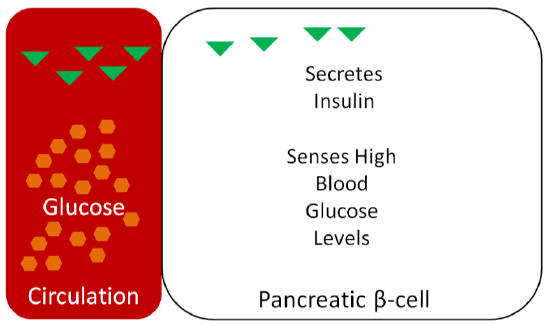
If only 30-40% of glucose is being taken up by the liver, then what happens to the rest? How the body handles the rise in blood glucose after dietary intake is referred to as the glycemic response. The pancreas senses the blood glucose levels and responds appropriately. After dietary intake, the pancreatic beta-cells sense that glucose concentrations are high and secrete the hormone insulin, as shown below1.
Thus, as can be seen in the following figure, blood insulin concentrations peak and drop with blood glucose concentrations over the course of a day.
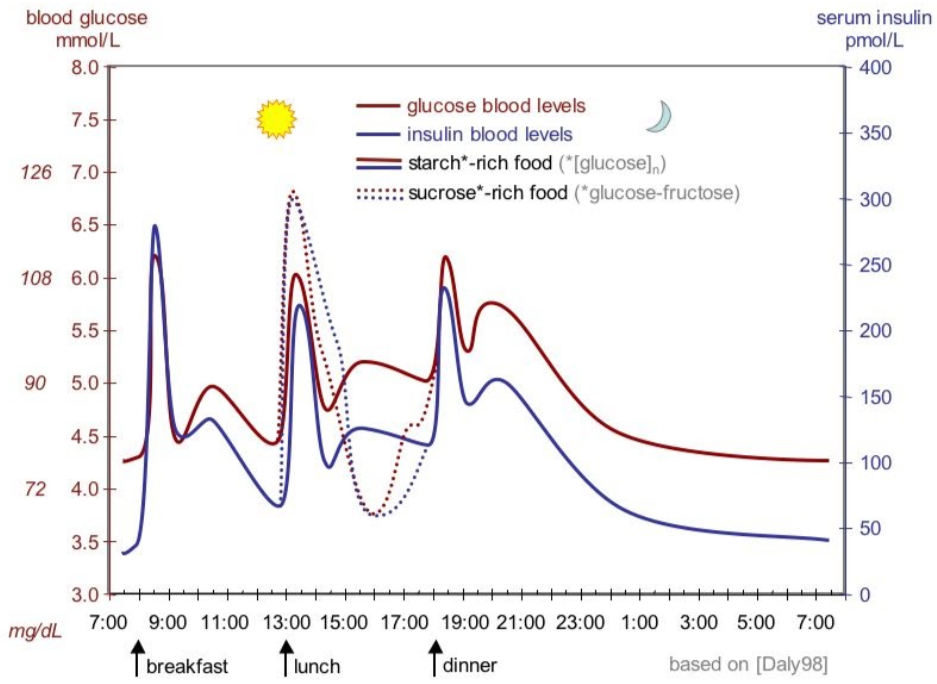
Blood glucose and insulin concentrations rise following carbohydrate intake, and they drop after tissues have taken up the glucose from the blood (described below). Higher than normal blood sugar concentrations are referred to as hyperglycemia, while lower than normal blood sugar concentrations are known as hypoglycemia.
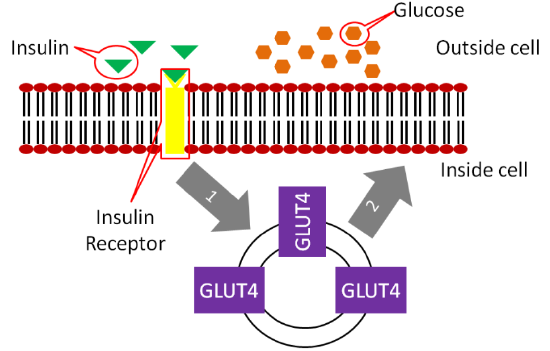
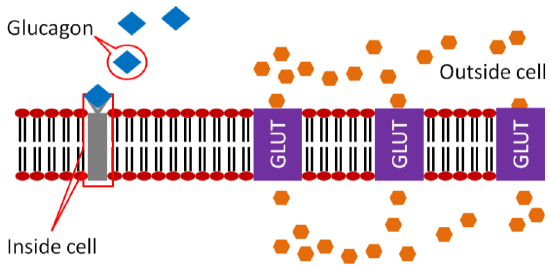
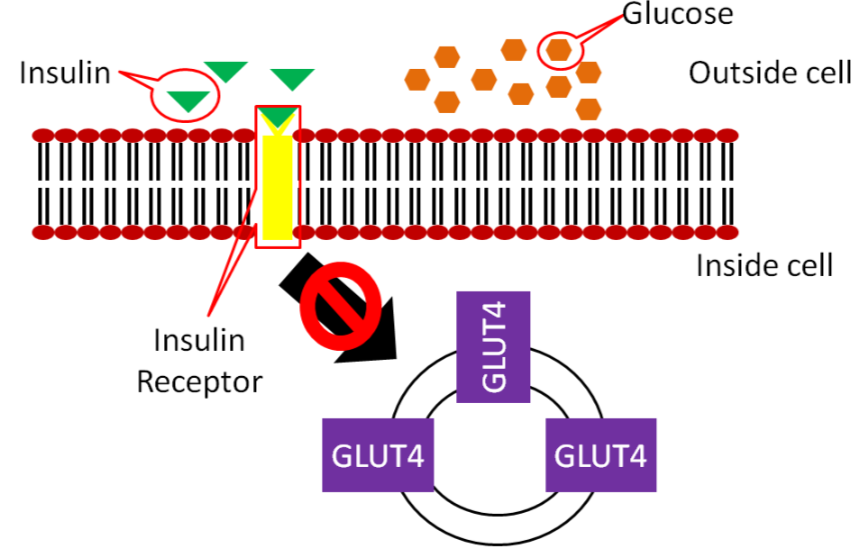
Insulin travels through the bloodstream to the muscle and adipose cells. There, insulin binds to the insulin receptor. This causes GLUT4 transporters that are in vesicles inside the cell to move to the cell surface as shown below.
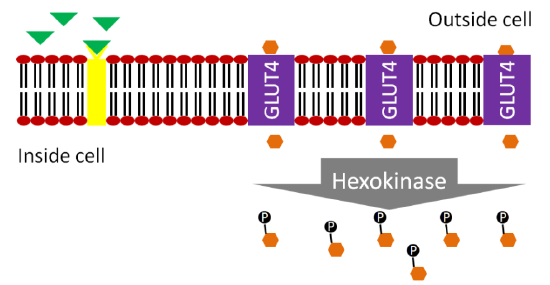
The movement of GLUT4 to the cell surface allows glucose to enter the muscle and adipose cells. The glucose is phosphorylated to glucose-6-phosphate by hexokinase (different enzyme but same function as glucokinase in liver) to maintain the concentration gradient.
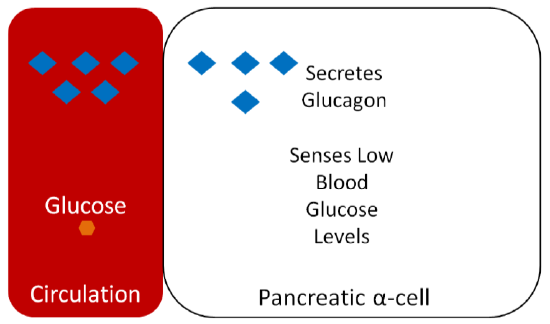
Glucagon is a hormone that has the opposite action of insulin. Glucagon is secreted from the alpha-cells of the pancreas when they sense that blood glucose levels are low, as shown below.
Glucagon binds to the glucagon receptor in the liver, which causes the breakdown of glycogen to glucose-1-phosphate (which is then converted to glucose-6-phosphate) as illustrated below.
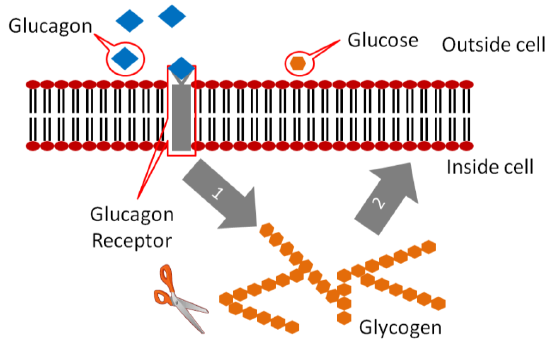
The glucose-6-phosphate has a phosphate removed and glucose is then released into circulation to raise blood glucose concentrations as shown below. You'll learn more about these pathways in chapter 6.
Diabetes
Diabetes mellitus is a condition of chronically high blood sugar levels. The prevalence of diabetes in the US has been rapidly increasing; the link below provides some statistics about prevalence.
There are 2 forms of diabetes, type 1 and type 2.
In type 1 diabetes, little to no insulin is produced and thus not enough insulin binds to the insulin receptor as shown in the figure below.
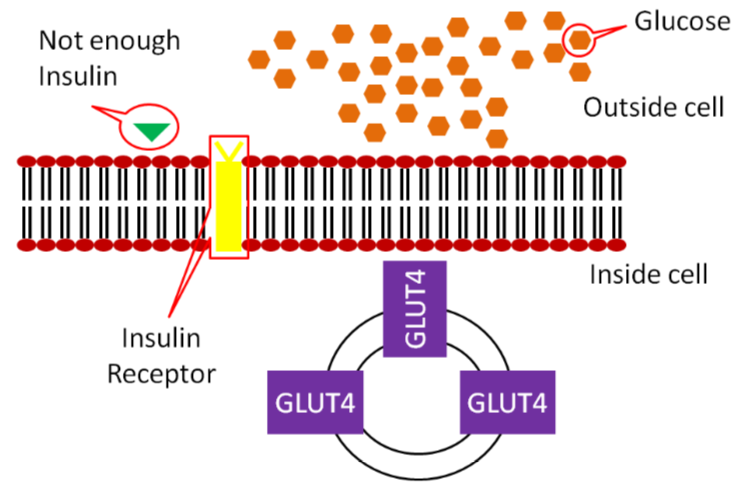
As a result, not enough GLUT4 makes it to the surface of muscle and adipose cells, meaning not enough glucose is taken up into these cells.
Type 1 diabetes was previously known as juvenile-onset, or insulin-dependent diabetes and is estimated to account for 5-10% of diabetes cases3. Type 1 diabetics receive insulin through injections or pumps to manage their blood sugar.
In Type 2 diabetes, the body produces enough insulin, but the person's body is resistant to it. In Type 2 diabetics the binding of insulin to its receptor does not cause enough GLUT4 to move to the surface of the muscle and adipose cells, thus not enough glucose is taken up.
Type 2 diabetes accounts for 90-95% of diabetes cases and was once known as non-insulin-dependent diabetes or adult-onset diabetes3. However, with the increasing rates of obesity, many younger people are being diagnosed with Type 2, making the latter definition no longer appropriate. Some people with Type 2 diabetes can control their condition with a diet and exercise regimen. This regimen improves their insulin sensitivity, or their response to the body’s own insulin. Others with Type 2 diabetes must receive insulin. These individuals may be producing enough insulin, but are so resistant to it that more is needed for glucose to be taken up by their muscle and adipose cells.
The video below illustrates Type 2 diabetes. However, I do not agree, nor do I teach, that type 2 diabetics have decreased insulin levels as described in the video.
Glycemic Index
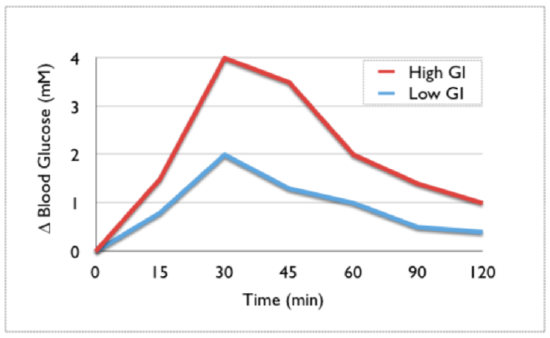
Research has indicated that hyperglycemia is associated with chronic diseases and obesity. As a result, measures of the glycemic response to food consumption have been developed so that people can choose foods with a smaller glycemic response. The first measure developed for this purpose was the glycemic index. The glycemic index is the relative change in blood glucose after consumption of 50 g of carbohydrate in a test food compared to 50 g of carbohydrates of a reference food (white bread or glucose). Thus, a high glycemic index food will produce a greater rise in blood glucose concentrations compared to a low glycemic index food, as shown below.
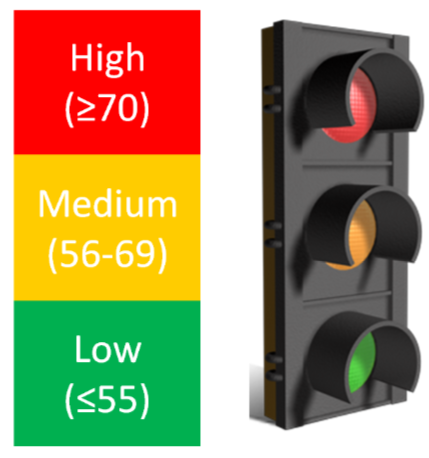
As a general guideline, a glycemic index that is 70 or greater is high, 56-69 is medium, and 55 and below is low. A stop light graphical presentation has been designed to emphasize the consumption of low glycemic index foods while cautioning against the consumption of too many high glycemic index foods5.
The main problem with the glycemic index is that it does not take into account serving size. Let's take popcorn (glycemic index 89-127) as an example. A serving size of popcorn is 20 g, 11 g of which is carbohydrate6. This is equal to approximately 2.5 cups of popcorn7. Thus, a person would have to consume over 11 cups of popcorn to consume 50 g of carbohydrate needed for the glycemic index measurement. Another example is watermelon, which has a glycemic index of 103, with a 120 g serving containing only 6 g of carbohydrates3. To consume 50 g of carbohydrates needed for glycemic index measurement, a person would need to consume over 1000 g (1 kg) of watermelon. Assuming this is all watermelon flesh (no rind), this would be over 6.5 cups of watermelon7.
The website glycemicindex.com (link provided below) contains a database where you can search to see the food's glycemic index and glycemic load (covered in the next section). The database contains details on how the measurement was done and more information on the product itself. The top link below will take you to this website. The second link is to another database that contains the same information that might be easier for some people to use. However, please note that in the second link the glycemic loads are calculated using 100 g serving sizes for all foods. This might not be the actual serving size for all foods, which is what is typically used, so it is important to keep this in mind.
Glycemic Load
To incorporate serving size into the calculation, another measure known as the glycemic load has been developed. It is calculated as shown below:
\[\text {Glycemic Load }= \text {(Glycemic Index } \times X \mathrm{g} \text {Carbs/serving)}/100 \nonumber \]
Thus, in most instances, the glycemic load is a more meaningful measure of the glycemic response of different foods. Considering the two examples from the glycemic index section, their glycemic loads would be:
Popcorn: \((89-127 \times 11 \mathrm{g} \text { Carbs/Serving }) / 100=10-14 \)
Watermelon: \((103 \times 6 \mathrm{g} \text { Carbs/Serving }) / 100=6.18\)
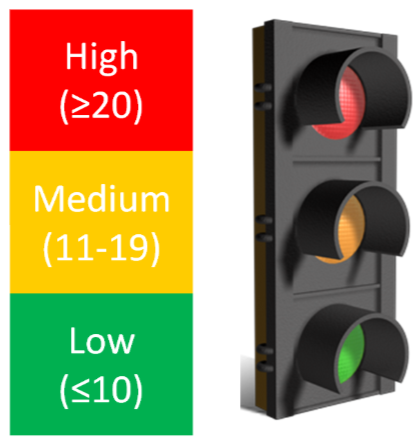
As a general guideline for glycemic loads of foods : 20 or above is high, 11-19 is medium, and 10 or below is low8,9.
Putting it all together, popcorn and watermelon have high glycemic indexes, but medium and low glycemic loads, respectively.
You can also use the top two links below to find the glycemic load of foods. However, please note that in the second link the glycemic loads are calculated using 100g serving sizes for all foods. This might not be the actual serving size for all foods, which is what is typically used, so it is important to keep this in mind. The third link is to the NutritionData estimated glycemic load tool that is pretty good at estimating the glycemic loads of foods, even if actual glycemic indexes have not been measured.
References
- Webb , Akbar , Zhao , Steiner . (2001) Expression profiling of pancreatic beta-cells: Glucose regulation of secretory and metabolic pathway genes. Diabetes 50 Suppl 1: S135.
- http://en.Wikipedia.org/wiki/File:Su...nsulin_day.jpg
- diabetes.niddk.nih.gov/dm/pub...atistics/#what
- upload.wikimedia.org/wikipedi...c/Glycemic.png
- www.glycemicindex.com
- Foster-Powell K, Holt SHA, Brand-Miller J. (2002) International table of glycemic index and glycemic load values: 2002. Am J Clin Nutr 76(1): 5.
- USDA National Nutrient Database - http://www.nal.usda.gov/fnic/foodcomp/search/
- http://www.mendosa.com/gilists.htm