
1.7: Respiratory Physiology Experiment
- Page ID
- 36456

Learning Objectives
- Define the following and label on a graph of spirometry data:
- Inspiration
- Expiration
- Total Lung Capacity (TLC)
- Inspiratory Reserve Volume (IRV)
- Expiratory Reserve Volume (ERV)
- Tidal Volume (TV)
- Vital Capacity (VC)
- Forced Vital Capacity (FVC)
- Forced Expiratory Volume (FEV1)
- Residual Volume (RV)
- Compare FVC to VC
- Describe, and demonstrate skills to listen to, bronchial and vesicular breathing sounds.
- Demonstrate proper lung function testing using a spirometer.
- Explain the clinical significance of reduced lung volume vs. reduced FEV1 in the context of restrictive and obstructive respiratory disorders.
Sounds of the Respiratory System
Listening to respiratory sounds, auscultation with a stethoscope, provides an indication of the health of respiratory tissue and ventilation function.
- Bronchial sounds – Measured over the tracheobronchial tree. High pitch, louder sound of air moving through trachea and bronchi.
- Vesicular sounds – Measured over the lung tissue. Low pitch, soft rustling sound of the air moving the alveolar sacs.
View and listen to Video 7.1 for descriptions and samples of respiratory sounds.
Instructions for Respiratory Sounds
- Using alcohol and wipes, clean the earpieces and stethoscope diaphragm and allow to dry.
- Rotate the stethoscope earpieces so they will face slightly anterior before placing in your ears.
- With the stethoscope diaphragm on the trachea above the suprasternal notch, listen to the bronchial sounds during normal breathing.
- Find the soft area immediately medial to the inferior section of the medial margin of the scapula. This is the triangle of auscultation, a location optimized for listening to lung sounds because there are fewer muscles over the ribs. Convince yourself of this by looking at the muscle anatomy of the back; observe the small space between the trapezius and latissimus dorsi at this site. Listen to the vesicular sounds, heard primarily upon inspiration.
Lung Volume and Function Tests with Spirometry
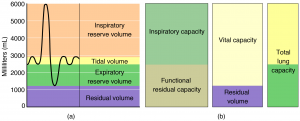
Lung volumes can be measured to determine the level of respiratory system health as well as the presence of various respiratory disorders. For example, if someone has pneumonia or tuberculosis, they will have reduced lung volume, and thus a restrictive lung disorder. In lung volume testing, the values differ between healthy individuals based on levels of physical fitness as well as age, sex, and size, so keep in mind the numbers you see in the figure are averages. Table 7.1 shows pulmonary (lung) function test measures. The spirometer—a device that measures movement of air—will provide us with a recording of a range of lung volumes. Residual Volume (RV) is the air that is left in the lungs after a maximal exhalation, so RV will be estimated today as 1.2 Liters. Capacities, such as Total Lung Capacity (TLC), refer to two or more volumes combined (Figure 7.1). One area that can cause some confusion for students is the reference to Vital Capacity (VC), Slow Vital Capacity (SVC), and Forced Vital Capacity (FVC). In healthy adult participants, VC, SVC, and FVC are practically the same. While VC and SVC are a full exhalation without a time requirement, FVC is forced as quickly as the patient can manage. For our data collection, we will call it FVC because your participant is going to exhale as quickly and forcefully as possible in order to measure the Forced Expiratory Volume in one second (FEV1) as a measure of asthma. To test for obstructive lung disorders such as asthma, the rate of air movement out of the lungs is measured to determine the level of resistance in the airways. If an air passage has increased resistance, the amount of air a person can exhale in one second (FEV1) will be less than for someone without a respiratory disorder.
| Pulmonary function measure | Definition |
|---|---|
| Forced vital capacity (FVC) | Volume of air forcefully exhaled after maximum inhalation |
| Forced expiratory volume 1 (FEV1) | Volume of air forcefully exhaled, in the first second, after maximum inhalation. |
| Total lung capacity (TLC) | Volume of air contained in lungs after maximum inhalation. |
| Peak expiratory flow (PEF) | Maximum speed of forceful exhalation after a maximum inhalation |
| Residual volume (RV) | Volume of air in lungs after maximum exhalation |
| Tidal volume (TV) | Volume of air moved in or out of the lungs during relaxed, subconscious breathing |
| Inspiratory reserve volume (IRV) | Volume of air that can be inhaled beyond tidal inhalation |
| Expiratory reserve volume (ERV) | Volume of air that can be exhaled beyond tidal exhalation |
| Residual volume (RV) | Volume of air remaining lungs after maximum exhalation |
Instructions for Spirometry
You have the opportunity to use two different types of spirometers today and then compare the data. It does not matter which device you use first.
Micro I Portable Spirometer
- If not charged, connect power supply cord to spirometer and then plug into electrical outlet and wait 5 minutes. Spirometer will not work while plugged in. After 5 minutes, unplug from outlet and disconnect power supply cord from device.
- Attach mouthpiece adaptor (2-inch white plastic tube) to spirometer. This piece is not disposable. Please note the storage location before removing from the case.
- Attach small end of disposable filter (has disc-like piece in middle) to mouthpiece adaptor.
- Press on/off button at top of device.
- Select Quick Exam (“Enter” is the bottom right, of the four buttons on front).
- Display will show person blowing into unit. This means device is ready.
- Inhale as deeply as possible, seal lips around mouthpiece, exhale as hard and fast and long as possible until no more air can be exhaled.
- If test needs to be repeated (e.g. display reads “Poor Effort”), use up and down arrows to select “Blow Again” and press Enter.
- Record your data.
- Separate filter from mouthpiece holder to be sure you do not throw the mouthpiece holder away.
- Return mouthpiece holder to storage case.
- Place disposable filter in biohazard waste. Only the filter is disposable.
- To check out, show your professor the pieces in your unit’s storage case to confirm all parts, including mouthpiece holder, are stowed properly.
Vernier Spirometer and Logger Pro Software
Materials:
- Laptop or desktop computer with Logger Pro software
- LabQuest Unit
- Vernier Handheld Spirometer
- Plastic disposable filter
- Nose clip
- Masking tape
Equipment and Computer Setup
Caution: If you have a respiratory illness, such as the flu or a cold, do not be the participant in this experiment.
- Do not turn on anything yet.
- Plug in the LabQuest unit into an electrical outlet. Note: If you’re using the iMac computers in the STEM A&P lab, skip to step 4 below. The LabQuest unit is on the back of the iMac computer.
- Attach the USB cable to the Lab Quest unit and to an available USB port on the laptop or desktop computer.
- Plug the spirometer into “Ch 1” of the LabQuest unit.
- Turn on the computer (If you’re using a laptop, make sure it’s plugged in to an outlet).
- Open the Logger Pro application.
- Click on “File” in the upper toolbar, “Open Recent,” then select “19 Lung Volume.”
- Click on “Page” in the upper toolbar and select “Next Page.” You should now see a new page on the screen titled “Pg 2: Lung Volume Measurements” with two graphs (“Lung Volume and Capacity” & “Flow Rate”).
- Turn on the LabQuest Unit by pressing the power button on the upper left hand corner. This step is not necessary if using iMac in STEM A&P lab.
Participant Instructions
- Connect the white plastic bacterial filter to the side of the handheld spirometer marked “Inlet.”
- While holding the spirometer straight and still, not yet in the mouth, click on “Experiment” in the upper toolbar and select “Zero.” This sets a baseline where there is no air movement through the spirometer and the participant does not have the spirometer in their mouth.
- Prepare your participant for the beginning of the test by having them stand, put on the nosepiece or plug nose with fingers, seal lips around the filter mouthpiece and begin breathing normally into the spirometer. Notice there is no data recording happening at this point; it is preparing the device for collection. Remind the participant that they need to try to breathe normally…a challenge with this setup!
- After a few normal breaths, the participant signals the computer computer operator when they are at the end of a normal expiration. Decide on the signal (e.g. a wiggle of the tiny finger on the hand holding the spirometer) before beginning recording. At the signal from the participant, the computer operator clicks on the green record button (upper right hand corner of the screen).
- The data collection portion of the experiment has your participant beginning the experiment by taking:
- Three normal breaths, followed by
- A maximal inspiration, followed by
- A maximal, forceful, fast expiration, followed by
- Three normal breaths
- The participant completes steps “a” through “d” (#5 above) after which the computer operator clicks on the red stop button. You should now see results that look something like this:
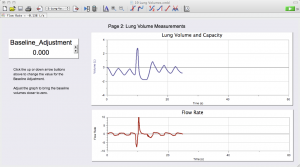
If your results don’t look like the example in Figure 7.2, click on “Data” in the top toolbar and select “Clear All Data,” then start over at step #3.
Measuring Tidal Volume (TV)
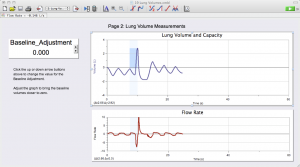
- Place the cursor over the graph and you will see a set of crosshairs appear. Place the crosshairs at one of the valleys in the participant’s tidal volume traces and drag it up to the next peak. You will see a blue highlighted box that appears (Figure 7.3).
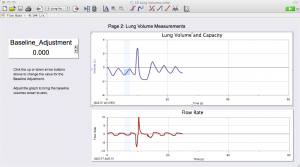
- Your lab group needs to record the Δ y value (0.95 Liters in this example) found in the bottom left corner of the top graph. This is your participant’s TV.
- Now repeat the process of creating a highlighted box from valley to peak and recording the Δ y value for:
- Inspiratory Reserve Volume (IRV)
- Expiratory Reserve Volume (ERV)
See Figures 7.4 and 7.5 for sample graphs of these two measurements

Performing the Lung Function Tests
- Click on “File” in the upper toolbar, “Open Recent,” then select “21 Analyze Lung
Function.” The following screen (Figure 7.6) will open on your computer:

- The only difference in running this test compared to the previous one is that the person at the computer will click the green record button when the participant signals that they are at the bottom of a normal expiration. Immediately after this signal, the participant will:
- Complete a maximal inspiration, followed by
- A maximal expiration, followed by
- A maximal inspiration.
- As soon as the participant completes their maximal inspiration, the computer operator clicks on the red button to stop the recording.
The resulting graph should be similar to the example in Figure 7.7:

Measuring Forced Expiratory Volume in One Second (FEV1)
1. Scroll down the left column (Time) until you get to the 1.00 (one second), then record the value in the third column (Volume in Liters). This is your participant’s FEV1. In the example below (Figure 7.8), the participant’s FEV1 is 3.972 Liters.
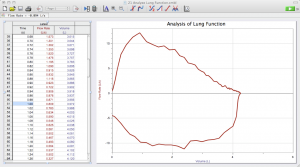
Measuring Forced Vital Capacity (FVC)
- Click on “Analyze” in the top toolbar and then click on the “Examine” function.
- This will make a vertical line appear when you move your cursor over the graph.
Move that vertical line to the farthest point to the right of the FVC trace and record the value in the small box at the top of the graph. In the sample below (Figure 7.9), the participant’s FVC is 4.250 Liters.

IMPORTANT: Please place disposable filters in biohazard bag provided by professor.
Label the graph (Figure 7.10), beginning with the axes, including units and values. Add in the names of the volumes and capacities.

Image by Laird Sheldahl / CC BY 4.0
Attributions for chapter 7:
The instructions for Vernier Spirometer and Logger Pro Software are modified from Zoology 142L Lab Packet, Will Jonen, CC BY