
10.3: Preparations for a census
- Page ID
- 13195
\( \newcommand{\vecs}[1]{\overset { \scriptstyle \rightharpoonup} {\mathbf{#1}} } \)
\( \newcommand{\vecd}[1]{\overset{-\!-\!\rightharpoonup}{\vphantom{a}\smash {#1}}} \)
\( \newcommand{\id}{\mathrm{id}}\) \( \newcommand{\Span}{\mathrm{span}}\)
( \newcommand{\kernel}{\mathrm{null}\,}\) \( \newcommand{\range}{\mathrm{range}\,}\)
\( \newcommand{\RealPart}{\mathrm{Re}}\) \( \newcommand{\ImaginaryPart}{\mathrm{Im}}\)
\( \newcommand{\Argument}{\mathrm{Arg}}\) \( \newcommand{\norm}[1]{\| #1 \|}\)
\( \newcommand{\inner}[2]{\langle #1, #2 \rangle}\)
\( \newcommand{\Span}{\mathrm{span}}\)
\( \newcommand{\id}{\mathrm{id}}\)
\( \newcommand{\Span}{\mathrm{span}}\)
\( \newcommand{\kernel}{\mathrm{null}\,}\)
\( \newcommand{\range}{\mathrm{range}\,}\)
\( \newcommand{\RealPart}{\mathrm{Re}}\)
\( \newcommand{\ImaginaryPart}{\mathrm{Im}}\)
\( \newcommand{\Argument}{\mathrm{Arg}}\)
\( \newcommand{\norm}[1]{\| #1 \|}\)
\( \newcommand{\inner}[2]{\langle #1, #2 \rangle}\)
\( \newcommand{\Span}{\mathrm{span}}\) \( \newcommand{\AA}{\unicode[.8,0]{x212B}}\)
\( \newcommand{\vectorA}[1]{\vec{#1}} % arrow\)
\( \newcommand{\vectorAt}[1]{\vec{\text{#1}}} % arrow\)
\( \newcommand{\vectorB}[1]{\overset { \scriptstyle \rightharpoonup} {\mathbf{#1}} } \)
\( \newcommand{\vectorC}[1]{\textbf{#1}} \)
\( \newcommand{\vectorD}[1]{\overrightarrow{#1}} \)
\( \newcommand{\vectorDt}[1]{\overrightarrow{\text{#1}}} \)
\( \newcommand{\vectE}[1]{\overset{-\!-\!\rightharpoonup}{\vphantom{a}\smash{\mathbf {#1}}}} \)
\( \newcommand{\vecs}[1]{\overset { \scriptstyle \rightharpoonup} {\mathbf{#1}} } \)
\( \newcommand{\vecd}[1]{\overset{-\!-\!\rightharpoonup}{\vphantom{a}\smash {#1}}} \)
\(\newcommand{\avec}{\mathbf a}\) \(\newcommand{\bvec}{\mathbf b}\) \(\newcommand{\cvec}{\mathbf c}\) \(\newcommand{\dvec}{\mathbf d}\) \(\newcommand{\dtil}{\widetilde{\mathbf d}}\) \(\newcommand{\evec}{\mathbf e}\) \(\newcommand{\fvec}{\mathbf f}\) \(\newcommand{\nvec}{\mathbf n}\) \(\newcommand{\pvec}{\mathbf p}\) \(\newcommand{\qvec}{\mathbf q}\) \(\newcommand{\svec}{\mathbf s}\) \(\newcommand{\tvec}{\mathbf t}\) \(\newcommand{\uvec}{\mathbf u}\) \(\newcommand{\vvec}{\mathbf v}\) \(\newcommand{\wvec}{\mathbf w}\) \(\newcommand{\xvec}{\mathbf x}\) \(\newcommand{\yvec}{\mathbf y}\) \(\newcommand{\zvec}{\mathbf z}\) \(\newcommand{\rvec}{\mathbf r}\) \(\newcommand{\mvec}{\mathbf m}\) \(\newcommand{\zerovec}{\mathbf 0}\) \(\newcommand{\onevec}{\mathbf 1}\) \(\newcommand{\real}{\mathbb R}\) \(\newcommand{\twovec}[2]{\left[\begin{array}{r}#1 \\ #2 \end{array}\right]}\) \(\newcommand{\ctwovec}[2]{\left[\begin{array}{c}#1 \\ #2 \end{array}\right]}\) \(\newcommand{\threevec}[3]{\left[\begin{array}{r}#1 \\ #2 \\ #3 \end{array}\right]}\) \(\newcommand{\cthreevec}[3]{\left[\begin{array}{c}#1 \\ #2 \\ #3 \end{array}\right]}\) \(\newcommand{\fourvec}[4]{\left[\begin{array}{r}#1 \\ #2 \\ #3 \\ #4 \end{array}\right]}\) \(\newcommand{\cfourvec}[4]{\left[\begin{array}{c}#1 \\ #2 \\ #3 \\ #4 \end{array}\right]}\) \(\newcommand{\fivevec}[5]{\left[\begin{array}{r}#1 \\ #2 \\ #3 \\ #4 \\ #5 \\ \end{array}\right]}\) \(\newcommand{\cfivevec}[5]{\left[\begin{array}{c}#1 \\ #2 \\ #3 \\ #4 \\ #5 \\ \end{array}\right]}\) \(\newcommand{\mattwo}[4]{\left[\begin{array}{rr}#1 \amp #2 \\ #3 \amp #4 \\ \end{array}\right]}\) \(\newcommand{\laspan}[1]{\text{Span}\{#1\}}\) \(\newcommand{\bcal}{\cal B}\) \(\newcommand{\ccal}{\cal C}\) \(\newcommand{\scal}{\cal S}\) \(\newcommand{\wcal}{\cal W}\) \(\newcommand{\ecal}{\cal E}\) \(\newcommand{\coords}[2]{\left\{#1\right\}_{#2}}\) \(\newcommand{\gray}[1]{\color{gray}{#1}}\) \(\newcommand{\lgray}[1]{\color{lightgray}{#1}}\) \(\newcommand{\rank}{\operatorname{rank}}\) \(\newcommand{\row}{\text{Row}}\) \(\newcommand{\col}{\text{Col}}\) \(\renewcommand{\row}{\text{Row}}\) \(\newcommand{\nul}{\text{Nul}}\) \(\newcommand{\var}{\text{Var}}\) \(\newcommand{\corr}{\text{corr}}\) \(\newcommand{\len}[1]{\left|#1\right|}\) \(\newcommand{\bbar}{\overline{\bvec}}\) \(\newcommand{\bhat}{\widehat{\bvec}}\) \(\newcommand{\bperp}{\bvec^\perp}\) \(\newcommand{\xhat}{\widehat{\xvec}}\) \(\newcommand{\vhat}{\widehat{\vvec}}\) \(\newcommand{\uhat}{\widehat{\uvec}}\) \(\newcommand{\what}{\widehat{\wvec}}\) \(\newcommand{\Sighat}{\widehat{\Sigma}}\) \(\newcommand{\lt}{<}\) \(\newcommand{\gt}{>}\) \(\newcommand{\amp}{&}\) \(\definecolor{fillinmathshade}{gray}{0.9}\)3.1 Planning
Early in the planning of a census, it is important to ascertain what information already exists about the population, either in national censuses or from local or national surveys that may have been conducted previously. In planning a census, it is important to seek the active collaboration of the community, generally through the community advisory board (CAB) and the local health services, using the special knowledge these groups are likely to have on the local population (see Chapter 9). This will also enable them to get to know their area better, and they may wish to use the information collected in the census for the benefit of the population, while the trial is in progress and after it has finished. Indeed, if local health workers and community leaders are not involved in the planning, they may be antagonistic to the study and may transmit these feelings to the study population.
In some populations, local administrative offices maintain up-to-date lists of tax payers that may give a good indication of the size of a population (or may not if large numbers of people avoid registering for tax collection!). Lists of voters or of residents may also be available through local administrative offices. Health or other surveys may also have been conducted previously. Gathering this information will entail visits to the study area, to government statistical offices, and possibly to universities or other institutions that may have organized specific surveys.
Useful data are usually available from national censuses, generally undertaken every 10 years. In the planning of a trial, census data may be used to select a suitable area such as a group of contiguous villages whose population is of adequate size for the trial. Often, however, the information in a national census is out of date or may be inaccurate. For example, a population census for a trial in Ghana found that the study census numbers matched those of the recent national census very well, except in one area that had applied to become a separate district where the national census numbers were roughly 50% higher than those in the study census! From a national census, it will usually be possible to obtain data for an area regarding the distribution of the population, with respect to age, sex, ethnic group, household size, and population density, though this may require a specific request to the census bureau. Estimates of mortality, fertility, and migration rates may also be available. Migration rates may be especially useful to estimate potential losses to follow-up in a longitudinal study.
For detailed planning and conduct of a trial, a special enumeration will usually be necessary. The population may be enumerated at the same time as the intervention is being started or as a separate exercise in advance. The decision regarding which to use will depend on the specific circumstances of the trial. In the rest of this chapter, the census is assumed to take place shortly prior to the start of the intervention, but the basic principles of enumeration are similar whenever it is conducted.
The initial census may be the first formal contact that most members of a population have with the trial team, though it should have been preceded by liaison of the trial organizers with local officials and local leaders (discussed in Chapter 9). The enumeration exercise provides an opportunity to explain the aims, objectives, and procedures to be used in the trial. For example, an information sheet or newsletter might be left with each household explaining key issues, announcing community meetings where the trial will be explained in more detail, and giving contact details for further information.
Although adequate time needs to be allocated for enumeration and mapping, these tasks should be conducted fairly rapidly to minimize the amount of migration, including from one house to another house within the study area, during the course of the census. The aim of a census is to enumerate the resident population as completely as possible, so the timing of the census is often very important. In areas where there is seasonal migration, the census might be planned for a period when most people are at their normal residence, and, in some populations, trading seasons and market days should be avoided. It may also be important to avoid the rainy season when areas may be inaccessible or the harvest season when people may spend most of the day away from their homes working in their fields. In urban areas, weekends may be the best time for surveys, since, during the week, a high proportion of people may be at work. The time of day may also be important. In some areas, it has been found best to conduct a census after dark, when people have returned from work, but this may not be acceptable or safe in other settings.
It is tempting to try to collect as much information as possible about the study population during the initial census such as information on education or fertility histories. In the interests of speed, however, it is usually preferable to collect such information in a separate round of interviews after the initial census.
Once they have been entered into a computer, data from the census may be used for printing questionnaires, lists of children, and so on, which will aid subsequent surveys (see, for example, Schellenberg et al., 2001).
To conduct a census, a house-to-house enumeration is necessary in most populations. In densely populated villages, with only a few items of data being collected for each individual, a fieldworker going from house to house might be expected to complete census schedules for about 200 people in a day. The number of households this will comprise will depend upon the population structure. In less densely populated areas or with a longer census schedule, 50 persons a day might be a realistic target (see also Chapters 14 and 20).
3.2 Pre-testing
The design and testing of questionnaires, including their pre-testing and pilot testing, whether developed for use with pen and paper or on mobile electronic devices such as mobile phones, tablet computers, or PDAs, are discussed in Chapters 13 and 14. This process will involve several steps, from initial drafting and pre-testing to pilot testing under field conditions on, say, between 50 and 200 households. Field testing will provide an opportunity to train and evaluate the performance of staff and may assist in the identification of those suitable to become supervisors for the main enumeration.
3.3 Recruitment and training of field staff
Guidelines for the recruitment of staff are given in Chapter 16. Training in census techniques is a good way of introducing staff to field research methods. Following instructional ‘classroom’ sessions, trainees should practise conducting a small census themselves.
3.4 Mapping
While a population census can be conducted without a detailed map being drawn, for many trials, especially large ones, or when the trial will last several years, they will greatly benefit from maps being drawn of the study area. These can be used for planning and conducting an initial census, for subsequent house-to-house surveys, and/or for following up participants, but also for displaying trial results and for spatial analyses.
The type and accuracy of mapping will depend on how maps are to be used, but there are two main types: paper maps (either official or hand-drawn) and digital maps.
The simplest mapping is the use of existing maps from Departments of Lands and Surveys (or their equivalents) and from special sources such as the Army, Agriculture Departments, Tourist Offices, and the Central Statistics Office (for example, maps that were specially drawn for a national census). These maps may provide enough information for the trial to be carried out without the need for further mapping. More likely, they will form the initial starting point for additional mapping.
While existing paper maps and hand-drawn maps may supply all the information required, digital maps provide far better functionality. For example, if looking at the relationship between a population and a water source or access to services, distances can be calculated quickly and easily, using digital mapping software.
Digital maps do not need to be expensive or complicated, and modern Internet mapping sites (for example, <https://maps.google.com> or <www.openstreetmap. org>) may provide maps of sufficient resolution to identify individual houses, streams, and tracks. Where data are missing, a global positioning system (GPS) device can be used to record the location of each household, uploading this information to a computer. These Internet mapping packages allow simple maps to be produced but have very limited scope for spatial analysis. If any spatial analysis is going to be carried out or in order to provide more flexibility with the mapping, dedicated mapping software is required. There is an increasing amount of both commercial and open source or freeware mapping software available such as ARCGIS (<http://www.esri.com>), MapInfo (<http://www.mapinfo.com>), and Quantum GIS (<http://www.qgis.org>).
GPS devices use signals from at least three satellites orbiting the earth to give the longitude and latitude of the hand-held device. The accuracy of the positioning depends upon the number of satellites from which a signal can be received and the strength of their signals. Usually, the accuracy is to within 20 metres, but, in open areas, with single- storey buildings or huts, it can be to within less than 10 metres, while, in areas with poor satellite coverage or where it is heavily forested, it can be worse than 50 metres. There are many ways to collect GPS data, including specific GPS receivers, data loggers, and modern mobile phones. The choice of which to use depends on how the GPS data are to be collected and used. If GPS data will be collected at the same time as other survey data, a GPS-enabled data logger may be most efficient. However, if the mapping is to be done as a separate exercise, dedicated GPS receivers are more cost-effective. Most GPS receivers can store several hundred ‘waypoints’ (for example, households or other points of interest for the map), which can be uploaded into computers at the end of each day’s work. The cost of a simple GPS receiver is around $100. Commonly used sys- tems are produced by Garmin (<http://www.garmin.com>), Magellan (<www. magellangps.com>), and Trimble (<http://www.trimble.com>).
When either paper or digital maps are obtained, the information recorded may be incomplete or inaccurate, and it should be checked in the field. Names of villages may have changed or they may be known by different names locally, and villages and households may have been abandoned or been newly formed if the maps are not re- cent. Checks, and alterations as necessary, should be made on the positions of roads and tracks, health facilities, schools, official offices, markets, churches, mosques, bars, shops, hotels, boreholes, and other locally important features.
In field trials, the first time that a map is likely to be needed is for planning the baseline survey. In longer-term field trials where houses will be revisited, individual houses are usually mapped. It is good practice to assign a code number to each house on the map. This may consist of a location (for example, village), code (for example, village BS), and a number to indicate the house within that location (for example, BS374). If it is locally acceptable, the number can be painted on the house or fixed to a board (take care: numbers painted on mud walls may be washed off in the rains or painted over, and boards with numbers can be taken down and moved by the residents to a new house!). This helps to ensure that each house is only mapped once and as a quick check on arrival at a house.
The numbering system should be designed to take account of the local family structures and their living arrangements. For example, in studies in some parts of Africa, the same number might be assigned to all houses that comprise a ‘compound’ where extended family members live. This is not always straightforward to do and is discussed further in Section 4.2.
Figure 10.1 shows part of four trial clusters of a large vitamin A trial in the Kintampo area of central Ghana (Kirkwood et al., 2010). The map was produced using ARCGIS software and shows roads, paths, schools, a hospital, a market, a refuse site, and two communal latrines, along with the location of each compound (identified with a 4-digit number).
Once each house or compound has been mapped and assigned a code, fieldworkers can use either a printed or digital map to locate the households that they need to visit. If small numbers of fieldworkers are involved, the list of households to be visited can be uploaded into a GPS receiver, and a ‘GO TO’ function used to direct the fieldworker to the location of the house. While these methods may not be exact, they can save large amounts of time.
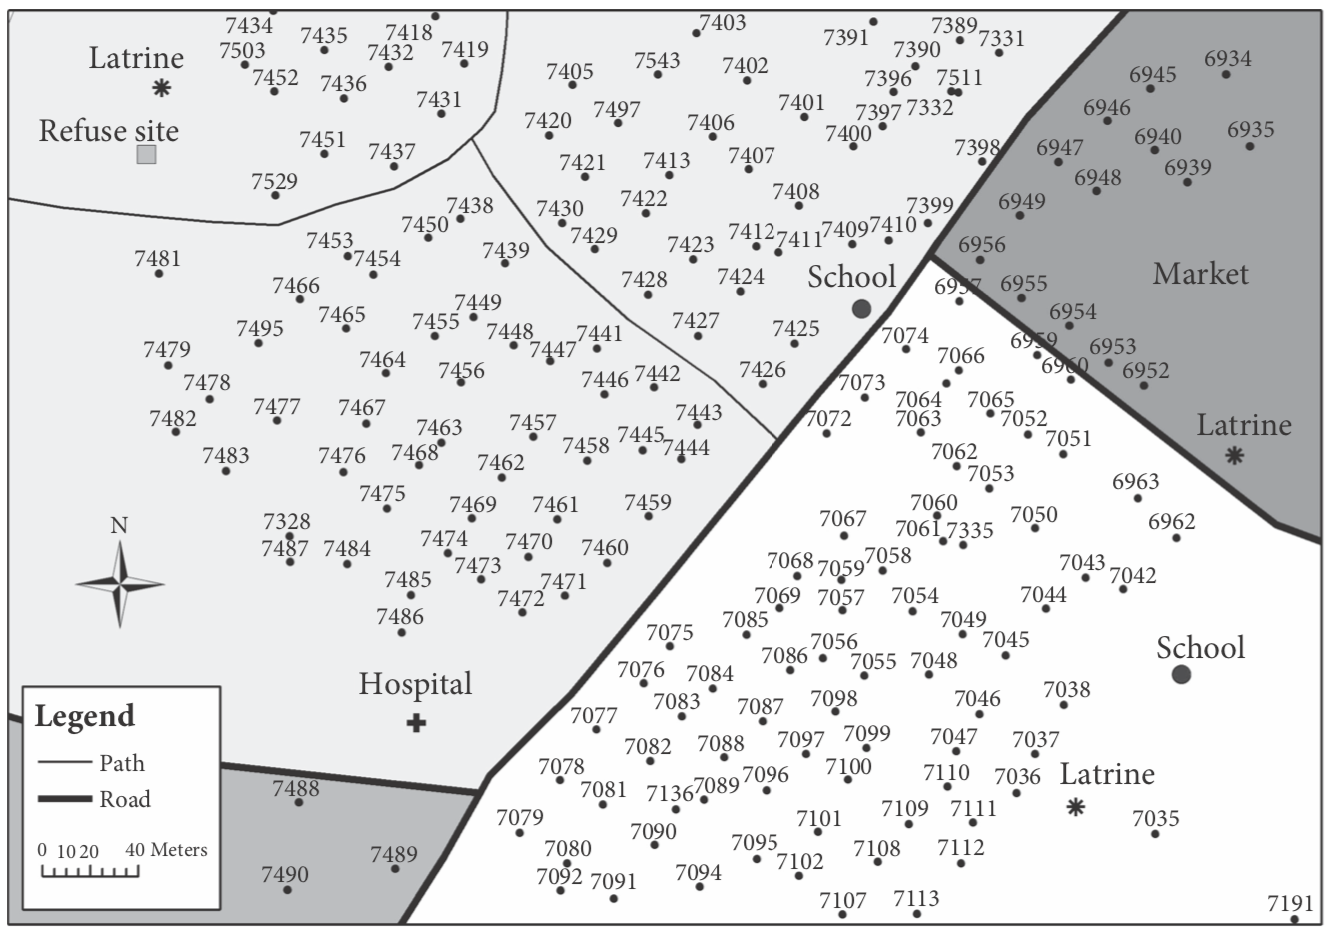
Figure 10.1 Part of a trial map.
Reproduced courtesy of C. Grundy, B. Kirkwood, and S. Owusu-Agyei. This image is distributed under the terms of the Creative Commons Attribution Non Commercial 4.0 International licence (CC-BY-NC), a copy of which is available at http://creativecommons.org/licenses/by-nc/4.0/.
Once a census has been carried out, the combination of the map and household population data can be used to delineate trial clusters or fieldwork areas. If the house- holds have been mapped digitally, there are functions to allow this to be done manually or using an automated method. Users simply specify the number of people required in each cluster, and either the user or the computer will group houses together to form clusters or groups of the appropriate size. Once fieldwork starts, maps can be printed
out, as required, or displayed on a hand-held computer to report on progress.
Maps are also very useful for dissemination of trial results and for community engagement. Because they can display data in a visually striking way, maps, if used well, can have a much bigger impact than other methods of displaying results such as tables or text. They can also be used at routine staff meetings during the trial, such as to display which
areas still need to be surveyed or to highlight where unusual results have been recorded. In many field trials, only simple mapping is required, but the more data that are available, the more spatial analyses can be carried out. The two commonest ways maps are used in analysis are spatial overlays and for calculation of distances. Many health outcomes have a spatial relationship to a risk factor, for example, schistosomiasis to water sources, or malaria to swamps, elevation, and climate. Here, the ‘exposure’ to these risk factors can be calculated, using Geographical Information System (GIS) software. This requires two geographical datasets: one for the population data and one for the risk factor data. Often, the risk factors, such as rivers and lakes, are collected as part of the mapping process. In other cases, datasets of vegetation type, rainfall, and elevation are available online or from satellite images. In simple cases, these ‘layers’ can be overlaid to link the population to the risk factor, for example, what the elevation, mean daily temperature, or annual rainfall at the location of each house is. If useful, the results from a regression analysis of such overlays can then be fed back into the computer mapping software to produce risk maps. There are very good examples of such risk maps for infectious diseases such as soil-transmitted helminths, trachoma, or malaria, for which global atlases have been produced (<www.thiswormyworld.
org>, <http://www.trachomaatlas.org>, <http://www.mara-database.org>).
The other spatial analysis that is commonly used is for calculating distances, for ex- ample, from a house to the nearest river or to the nearest health facility. This type of analysis is widely used to investigate access to services. An example of this in a multisite community-based social mobilization trial related to HIV counselling and testing in
South Africa is given in Chirowodza et al. (2009).
Computer mapping and spatial analysis are increasingly being used in trials, and the
methods available are constantly being improved and refined. For example, satellite imagery is increasingly being used to plan surveys, as this does not require someone to physically visit and locate each house, in order to create the map. It is possible to use the images provided by sites, such as Google Earth, to mark the location of each structure in the trial area. Once all structures are marked, these can either form the basis for a full survey or a random selection of structures can be selected and surveyed. In some cases, the approximate population can be estimated by multiplying the number of structures by a population per structure estimate. These methods currently tend to be used by research groups with relatively advanced GIS expertise but will increasingly be used more widely, as user-friendly software packages are developed.