
11.1: Indicators of Health: Body Mass Index, Body Composition, and Fat Distribution
- Page ID
- 21170
Learning Objectives
- Identify ways to evaluate body weight.
- Calculate body mass index (BMI) given a particular weight and height.
- Identify weight status based on BMI.
- Describe factors that affect body composition and fat distribution.
Although the terms "overweight" and "obese" are often used interchangeably, they mean different things. Body weight consists of water weight, lean muscle weight, bone weight, and weight from body fat (adipose). "Overweight" refers to having more weight than is typical for a particular height. That weight may be the result of water weight, muscle weight, or fat mass. "Obese" refers specifically to having excess body fat. In most cases people who are overweight also have excessive body fat and therefore body weight is an indicator of obesity in much of the population. This section will review three ways to evaluate body weight: body mass index (BMI), body composition, and fat distribution.
Body Mass Index (BMI)
Body mass index (BMI) is calculated using weight and height measurements and is more predictive of health risk than using weight alone. BMI measurements are used to indicate whether an individual may be underweight, normal weight, overweight, or obese. BMI is defined as the body mass (weight) divided by the square of body height, and is universally expressed in units of kg/m2, resulting from mass in kilograms and height in meters.
\[\text{BMI} = \frac{\text{weight } (kg)}{\text{height } (m^2)}\nonumber\]
There is also a calculation that uses weight in pounds (lb) and height in inches (in):
\[\text{BMI} = \frac{\text{weight } (lb)}{\text{height } (in^2)} \text{ X 703} \nonumber\]
In addition, there are online BMI calculators that can be used, including those from the:
BMI attempts to quantify the amount of tissue mass (muscle, fat, and bone) in an individual, and then categorize that person as underweight, normal weight, overweight, or obese based on that value. Commonly accepted BMI categories are included in Table \(\PageIndex{1}\).
| Weight Status | BMI |
|---|---|
| Underweight | < 18.5 |
| Normal weight | 18.5–24.9 |
| Overweight | 25.0–29.9 |
| Obese | 30.0 and above |
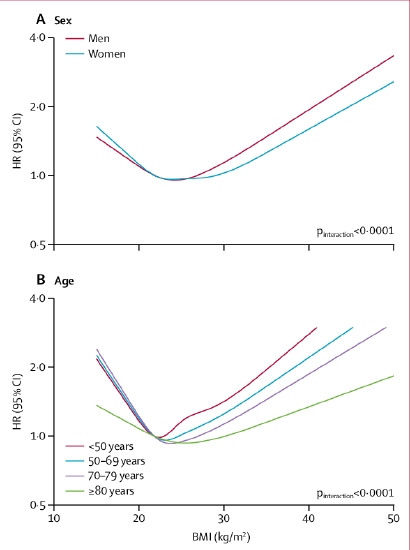
Very high and very low BMIs appear to increase a person's risk of dying (mortality). If you look at a graph of BMI as it relates to your risk of dying, it has a "J shaped curve" or a "U shaped curve" because having too low or too high of a BMI raises your risk of mortality (Figure \(\PageIndex{1}\)). Instead, you'd like to be in the middle range of the BMI which is what they use for "normal weight".
Limitations of BMI
BMI is a fairly simple measurement. However, it does not take into account fat mass or fat distribution in the body, both of which are additional predictors of disease risk. Body fat weighs less than muscle mass. Therefore, BMI can sometimes underestimate the amount of body fat in overweight or obese people and overestimate it in more muscular people. For instance, a muscular athlete will have more muscle mass (which is heavier than fat mass) than a couch potato of the same height. Based on their BMIs the muscular athlete would be less “ideal” and may be categorized as more overweight or obese than the couch potato; however this is an infrequent problem with BMI calculation. BMI does not take into consideration the effect of age or ethnicity on BMI. An older person with osteoporosis (decreased bone mass) will have a lower BMI than an older person of the same height without osteoporosis, even though the person with osteoporosis may have more fat mass. Recently, a new policy of the American Medical Association recognized issues with using BMI as a measurement due to its historical harm, use for racist exclusion, and because BMI cutoffs are based primarily on data from non-Hispanic white populations and doesn't consider a person's gender or ethnicity.1 BMI also has limitations when used with pregnant and lactating women. Ultimately, BMI is a useful inexpensive tool to categorize people and is highly correlative with disease risk, but other measurements are needed to diagnose obesity and more accurately assess disease risk.
Body Composition
Water, organs, bone tissue, fat, and muscle tissue make up a person’s weight. Having more fat mass may be indicative of disease risk, but fat mass also varies with sex, age, and physical activity level. Females have more fat mass, which is needed for reproduction and, in part, is a consequence of different levels of hormones. The optimal fat content of a female is between 20 and 30% of her total weight and for a male is between 12 and 20%. Fat mass can be measured in a variety of ways including:
- Skin-fold test. This method is perhaps the simplest and lowest-cost way to measure body composition. A health professional uses a caliper to measure the thickness of skin on the back, arm, and other parts of the body and compares it to standards to assess body fatness. It is a noninvasive and fairly accurate method of measuring fat mass, but should be done by a trained professional using appropriate calculations based on individual demographics.
- Underwater weighing. This technique requires a chamber full of water big enough for the whole body to fit in. First, a person is weighed outside the chamber and then weighed again while immersed in water. Bone and muscle weigh more than water, but fat does not—therefore a person with a higher muscle and bone mass will weigh more when in water than a person with less bone and muscle mass.
- Bioelectric Impedance Analysis (BIA). This device is based on the fact that fat slows down the passage of electricity through the body. When a small amount of electricity is passed through the body, the rate at which it travels is used to determine body composition. These devices are also sold for home use and commonly called body composition scales.
- Dual-Energy X-ray Absorptiometry (DEXA). This technique is used to measure bone density. It also can determine fat content via the same method, which directs two low-dose x-ray beams through the body and determines the amount of the energy absorbed from the beams. The amount of energy absorbed is dependent on the body’s content of bone, lean tissue mass, and fat mass. Using standard mathematical formulas, fat content can be accurately estimated.
Fat Distribution
Total fat mass in the body is one predictor of health; another is how the fat is distributed in the body. You may have heard that fat on the hips is better than fat in the belly—this is true. Fat can be found in different areas in the body and it does not all act the same, meaning it differs physiologically based on location. Fat deposited in the abdominal cavity is called visceral fat and is a better predictor of disease risk than total fat mass. Visceral fat releases hormones and inflammatory factors that contribute to disease risk. The only tool required for measuring visceral fat is a measuring tape. Two measurements are typically used to determine fat distribution:
- Waist Circumference. A person's waist circumference is measured at their natural waist (just above the belly button). Men with a waist circumference greater than 40 inches and women with a waist circumference greater than 35 inches are predicted to face greater risk for chronic disease.
- Waist-to-Hip Ratio. The waist-to-hip ratio is often considered a better measurement than waist circumference alone in predicting disease risk. To calculate your waist-to-hip ratio, use a measuring tape to measure your waist circumference and then measure your hip circumference at its widest part. Next, divide the waist circumference by the hip circumference to arrive at the waist-to-hip ratio. Observational studies have demonstrated that people with “apple-shaped” bodies, (who carry more weight around the waist/upper body) have greater risks for chronic disease than those with “pear-shaped” bodies, (who carry more weight around the hips/lower body). It's thought that apple-shaped patterning causes problems with fat and carbohydrate metabolism, leading to unhealthy changes in blood cholesterol, insulin, glucose and blood pressure.Abdominal obesity is defined by the World Health Organization (WHO) as having a waist-to-hip ratio above 0.90 for males and above 0.85 for females.2
Key Takeaways
- Most people who are overweight also have excessive body fat and therefore body weight is an indicator of obesity in much of the population.
- Body weight can be evaluated using BMI, body composition and/or fat distribution.
- Body weight in relation to height is called BMI and is correlated with disease risk.
- Total body fat mass is another predictor of disease risk and can be measured using a variety of methods including skin-fold tests, underwater weighing, bioelectric impedance analysis, and dual-energy x-ray absorptiometry.
- Fat distribution is measured via waist circumference and/or waist-to-hip ratio.
References
Chapter cover photo "Scale of Justice" by DTR is licensed under CC0.
- American Medical Association. AMA: Use of BMI alone is an imperfect clinical measure. https://www.ama-assn.org/delivering-care/public-health/ama-use-bmi-alone-imperfect-clinical-measure. Accessed March 26, 2024.
- World Health Organization. Waist circumference and waist–hip ratio: report of a WHO expert consultation. Geneva, Switzerland: WHO Press; 2011. https://apps.who.int/iris/bitstream/handle/10665/44583/9789241501491_eng.pdf?ua=1. Accessed July 6, 2020.