
Glossary
- Page ID
- 89596

\( \newcommand{\vecs}[1]{\overset { \scriptstyle \rightharpoonup} {\mathbf{#1}} } \)
\( \newcommand{\vecd}[1]{\overset{-\!-\!\rightharpoonup}{\vphantom{a}\smash {#1}}} \)
\( \newcommand{\dsum}{\displaystyle\sum\limits} \)
\( \newcommand{\dint}{\displaystyle\int\limits} \)
\( \newcommand{\dlim}{\displaystyle\lim\limits} \)
\( \newcommand{\id}{\mathrm{id}}\) \( \newcommand{\Span}{\mathrm{span}}\)
( \newcommand{\kernel}{\mathrm{null}\,}\) \( \newcommand{\range}{\mathrm{range}\,}\)
\( \newcommand{\RealPart}{\mathrm{Re}}\) \( \newcommand{\ImaginaryPart}{\mathrm{Im}}\)
\( \newcommand{\Argument}{\mathrm{Arg}}\) \( \newcommand{\norm}[1]{\| #1 \|}\)
\( \newcommand{\inner}[2]{\langle #1, #2 \rangle}\)
\( \newcommand{\Span}{\mathrm{span}}\)
\( \newcommand{\id}{\mathrm{id}}\)
\( \newcommand{\Span}{\mathrm{span}}\)
\( \newcommand{\kernel}{\mathrm{null}\,}\)
\( \newcommand{\range}{\mathrm{range}\,}\)
\( \newcommand{\RealPart}{\mathrm{Re}}\)
\( \newcommand{\ImaginaryPart}{\mathrm{Im}}\)
\( \newcommand{\Argument}{\mathrm{Arg}}\)
\( \newcommand{\norm}[1]{\| #1 \|}\)
\( \newcommand{\inner}[2]{\langle #1, #2 \rangle}\)
\( \newcommand{\Span}{\mathrm{span}}\) \( \newcommand{\AA}{\unicode[.8,0]{x212B}}\)
\( \newcommand{\vectorA}[1]{\vec{#1}} % arrow\)
\( \newcommand{\vectorAt}[1]{\vec{\text{#1}}} % arrow\)
\( \newcommand{\vectorB}[1]{\overset { \scriptstyle \rightharpoonup} {\mathbf{#1}} } \)
\( \newcommand{\vectorC}[1]{\textbf{#1}} \)
\( \newcommand{\vectorD}[1]{\overrightarrow{#1}} \)
\( \newcommand{\vectorDt}[1]{\overrightarrow{\text{#1}}} \)
\( \newcommand{\vectE}[1]{\overset{-\!-\!\rightharpoonup}{\vphantom{a}\smash{\mathbf {#1}}}} \)
\( \newcommand{\vecs}[1]{\overset { \scriptstyle \rightharpoonup} {\mathbf{#1}} } \)
\(\newcommand{\longvect}{\overrightarrow}\)
\( \newcommand{\vecd}[1]{\overset{-\!-\!\rightharpoonup}{\vphantom{a}\smash {#1}}} \)
\(\newcommand{\avec}{\mathbf a}\) \(\newcommand{\bvec}{\mathbf b}\) \(\newcommand{\cvec}{\mathbf c}\) \(\newcommand{\dvec}{\mathbf d}\) \(\newcommand{\dtil}{\widetilde{\mathbf d}}\) \(\newcommand{\evec}{\mathbf e}\) \(\newcommand{\fvec}{\mathbf f}\) \(\newcommand{\nvec}{\mathbf n}\) \(\newcommand{\pvec}{\mathbf p}\) \(\newcommand{\qvec}{\mathbf q}\) \(\newcommand{\svec}{\mathbf s}\) \(\newcommand{\tvec}{\mathbf t}\) \(\newcommand{\uvec}{\mathbf u}\) \(\newcommand{\vvec}{\mathbf v}\) \(\newcommand{\wvec}{\mathbf w}\) \(\newcommand{\xvec}{\mathbf x}\) \(\newcommand{\yvec}{\mathbf y}\) \(\newcommand{\zvec}{\mathbf z}\) \(\newcommand{\rvec}{\mathbf r}\) \(\newcommand{\mvec}{\mathbf m}\) \(\newcommand{\zerovec}{\mathbf 0}\) \(\newcommand{\onevec}{\mathbf 1}\) \(\newcommand{\real}{\mathbb R}\) \(\newcommand{\twovec}[2]{\left[\begin{array}{r}#1 \\ #2 \end{array}\right]}\) \(\newcommand{\ctwovec}[2]{\left[\begin{array}{c}#1 \\ #2 \end{array}\right]}\) \(\newcommand{\threevec}[3]{\left[\begin{array}{r}#1 \\ #2 \\ #3 \end{array}\right]}\) \(\newcommand{\cthreevec}[3]{\left[\begin{array}{c}#1 \\ #2 \\ #3 \end{array}\right]}\) \(\newcommand{\fourvec}[4]{\left[\begin{array}{r}#1 \\ #2 \\ #3 \\ #4 \end{array}\right]}\) \(\newcommand{\cfourvec}[4]{\left[\begin{array}{c}#1 \\ #2 \\ #3 \\ #4 \end{array}\right]}\) \(\newcommand{\fivevec}[5]{\left[\begin{array}{r}#1 \\ #2 \\ #3 \\ #4 \\ #5 \\ \end{array}\right]}\) \(\newcommand{\cfivevec}[5]{\left[\begin{array}{c}#1 \\ #2 \\ #3 \\ #4 \\ #5 \\ \end{array}\right]}\) \(\newcommand{\mattwo}[4]{\left[\begin{array}{rr}#1 \amp #2 \\ #3 \amp #4 \\ \end{array}\right]}\) \(\newcommand{\laspan}[1]{\text{Span}\{#1\}}\) \(\newcommand{\bcal}{\cal B}\) \(\newcommand{\ccal}{\cal C}\) \(\newcommand{\scal}{\cal S}\) \(\newcommand{\wcal}{\cal W}\) \(\newcommand{\ecal}{\cal E}\) \(\newcommand{\coords}[2]{\left\{#1\right\}_{#2}}\) \(\newcommand{\gray}[1]{\color{gray}{#1}}\) \(\newcommand{\lgray}[1]{\color{lightgray}{#1}}\) \(\newcommand{\rank}{\operatorname{rank}}\) \(\newcommand{\row}{\text{Row}}\) \(\newcommand{\col}{\text{Col}}\) \(\renewcommand{\row}{\text{Row}}\) \(\newcommand{\nul}{\text{Nul}}\) \(\newcommand{\var}{\text{Var}}\) \(\newcommand{\corr}{\text{corr}}\) \(\newcommand{\len}[1]{\left|#1\right|}\) \(\newcommand{\bbar}{\overline{\bvec}}\) \(\newcommand{\bhat}{\widehat{\bvec}}\) \(\newcommand{\bperp}{\bvec^\perp}\) \(\newcommand{\xhat}{\widehat{\xvec}}\) \(\newcommand{\vhat}{\widehat{\vvec}}\) \(\newcommand{\uhat}{\widehat{\uvec}}\) \(\newcommand{\what}{\widehat{\wvec}}\) \(\newcommand{\Sighat}{\widehat{\Sigma}}\) \(\newcommand{\lt}{<}\) \(\newcommand{\gt}{>}\) \(\newcommand{\amp}{&}\) \(\definecolor{fillinmathshade}{gray}{0.9}\)Absorption: The first stage of pharmacokinetics, when medications enter the body and travel from the site of administration into the body’s circulation, crossing membranes in the process.
Adverse effect: An unintended and potentially dangerous pharmacological effect when medication is administered correctly.
Affinity: The strength of binding between a drug and a receptor.

Agonist: A drug or ligand that binds to a receptor and produces a direct or indirect effect. Agonists may be full or partial.
Antagonist: A molecule that prevents the action of other molecules, often by competing for a cellular receptor; opposite of agonist. Antagonists may be further described as competitive, non-competitive, or irreversible. Drug (red triangle) binds to the receptor, but there is no clinical effect.

Bioavailability: The amount or presence of a drug in the bloodstream after it is administered. Bioavailability varies with the route of administration and is usually expressed as a percentage. The bioavailability of an intravenous drug (IV) is 100% or 1. Any other route of administration is less than 100% or 1. Bioavailability is described as the area under the curve (AUC).

Blood–brain barrier (BBB): A nearly impenetrable barricade built from a tightly woven mesh of capillaries tightly woven together to protect the brain from potentially dangerous substances such as poisons, viruses, or drugs. The figure of the capillary cross section of the BBB shows the tight junctions between endothelial cells and the location of the P-glycoproteins (PGP). Notice that the PGP effluxes molecules from the neuron into the bloodstream.

Clearance: The ratio of the rate of elimination of a drug to the plasma concentration of the drug. Clearance has an inverse relationship to half-life.

Competitive antagonists: the dose-response curve for an agonist alone is labeled A. The curve for an agonist plus a competitive antagonist is labeled A". The competitive antagonist shifts the agonist curve to the right. An irreversible, also called non-competitive, antagonist is labeled A'. A non-competitive antagonist shifts the agonist curve downward, decreasing the maximal response.

Competitive inhibition: The drug competes with a substrate for an active binding site.,

CYP (Cytochrome) P450 family: Enzymes responsible for the metabolism of most drugs; there are many isoforms of CYP enzymes.
Distribution: The second stage of pharmacokinetics is the process by which a medication moves from the site of administration to tissues throughout the body.
Dose-response curve: Graph showing the relationship between a dose or drug concentration and its effectiveness, often measured as a clinical response. As the dose of a drug increases, ideally, the response to the drug should also increase until saturation is reached. The slope and shape of the curve are characteristic of the particular drug–receptor interaction. The drug concentration is expressed as a logarithmic dose.

Duration: The length of time a medication produces its desired therapeutic effect.
Efficacy: The ability of a drug to produce a particular effector response. The plateau represents the maximum effect achieved with a drug, no matter how much of the drug is given.

Excretion: The final stage of pharmacokinetics, the process whereby drug byproducts and metabolites are eliminated from the body. Renal and liver excretion are the most common forms of drug removal, but drugs may also be excreted through the lungs (exhalation), skin (sweat), and mammary glands (breast milk). 
First-order kinetics: When a drug follows a first-order pattern of elimination pharmacokinetics, the elimination rate depends on the plasma concentration. As the plasma concentration increases, so does the rate of elimination, as demonstrated by the graph on the left.

First-pass effect: The inactivation of orally or enterally administered drugs in the liver and intestine. Blood containing the absorbed drug passes through the liver and goes through chemical reactions that can deactivate a substantial amount of the drug, thus decreasing its bioavailability and efficacy.
Half-life: A drug's half-life (t1/2) is the measure of time it takes for the concentration of a drug in the body to be reduced by half. Half-life is related to the kinetics (first-order or zero-order) elimination pattern of the drug.

Induction: Increased synthesis and/or activity of drug-metabolizing enzymes. In the illustration below, the inducer is the green molecule (another drug or ligand), the purple shape is a drug metabolizing enzyme, and the drug is the pink triangle. When the inducer is present, more drug-metabolizing enzymes are produced, which decreases the steady state of the drug as depicted in the graph on the right, showing a decline in drug concentration after adding an inducer.

Inhibition: Decreased synthesis of drug-metabolizing enzymes or interference with how an enzyme works. The effects of the inhibitor are the opposite of an inducer. When an inhibitor is added, the number or activity of the drug-metabolizing enzymes decreases, and the steady state rises. The increase in drug concentration in the body can lead to adverse events, toxicity, and potentially lethal effects.
Intermediate metabolizer: One of the categories of metabolizing phenotypes, displaying slightly reduced metabolic activity.
Lethal dose or LD50: Lethal dose of a drug for 50% of the population in an animal study. The graph below shows the drug concentration that causes 50% mortality.

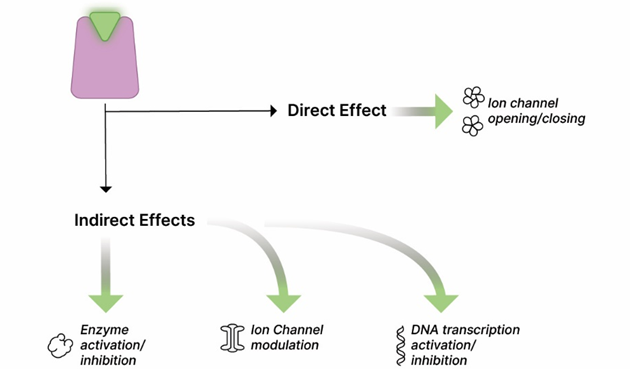
Mechanism of action (MOA): How a medication works at the molecular or cellular level within the body to achieve a desired biological response or outcome. The molecular interaction may include how a drug binds to its target receptor (beta blockers), inhibits an enzyme or protein (immunosuppressants), or interacts with DNA or RNA (antimicrobials). These interactions may cause changes in cellular function, such as cell growth, division, or the production/inhibition of specific molecules. Ultimately, the MOA should lead to the drug's desired biological response or therapeutic effect.
Metabolism: The breakdown of a drug molecule via enzymes in the liver (primarily) or intestines (secondarily).
Non-competitive antagonists: A drug that binds to a non-agonist site on the receptor but still prevents activation of the receptor. The illustration on the right shows a drug (pink) that cannot interact with its binding site due to the presence of an inhibitor bound to the target molecule at a different site. A corresponding concentration vs. time graph shows loss of steady state once the inhibitor is added. Concentration increases over time.

Normal metabolizer: The reference metabolizing phenotype with two functioning alleles.
Onset: The time it takes for a medication to begin to work and exert a therapeutic effect after administration. Onset will vary depending on the route of administration.
P-glycoprotein (PGP): An efflux transmembrane protein that transports various substances, including drugs, across epithelial membranes. The protein protects against xenobiotics and is found in intestines, liver, kidney, placenta and blood brain barrier. The illustration below shows the location and activity of PGP for an enterocyte (location varies by tissue type). The drug moves from the bloodstream or circulation into the enterocyte. The PGP, located on the brush border side of the cell, "escorts" it into the intestinal lumen where it is excreted.

Peak: When a drug reaches its maximum concentration in the bloodstream. The graph below shows the AUC (time vs plasma drug concentration) as a bell-shaped curve with the maximum concentration at the midpoint. The AUC varies by drug and route of administration. Three important concentration parameters are labeled on the right-hand side of the graph: minimum effective concentration, therapeutic range, and toxic concentration.

Phase I reactions: CYP450 enzyme reactions convert the parent drug into a more polar, water-soluble metabolite, making the drug easier to eliminate. These enzymes are not highly selective for their substrate, so a few isoforms metabolize thousands of drugs.
Phase II reactions: Reactions that increase the water solubility of a drug.
Pharmacodynamics: The study of how drugs act at target sites of action in the body.
Pharmacogenetics: A branch of pharmacology that studies individual variation in the DNA sequence in drug metabolism and response. The diagram below reviews key genetic concepts from genotype, nucleotide base sequencing, and phenotype using Punnett's square.

Pharmacogenomics: A branch of pharmacology that studies population variation in the DNA sequence in drug metabolism and response.
Pharmacokinetics: The study of how the body absorbs, distributes, metabolizes, and eliminates drugs.
Pharmacology: The science dealing with the actions of drugs on the body.
Pharmacy: The science of the preparation of drugs.
Poor metabolizer: An individual who displays little to no functional metabolic activity for prodrugs and toxicity for parent drugs.

Potency: The drug dose required to produce a specific intensity of effect. The graph of dose-response curves for different drugs shows the difference in potency. The more potent drug requires a lower dose of drug concentration to elicit a response.

Rapid metabolizer: A metabolizing phenotype that shows increased metabolic activity.
Selectivity: A “selective” drug binds to a primary and predictable site to create one desired effect. A “non-selective” drug is less predictable, binding to multiple receptor sites with potentially more side effects.
Side effect: Effect of a drug, other than the desired effect, sometimes in an organ other than the target organ. Side effects are also called unintended medication outcomes.
Single nucleotide polymorphism (SNP): a variation of a nucleotide (A, T, C, and G) at a single position in a DNA sequence among individuals. SNPs are common and found in at least 1% of the population. SNPs can influence how individuals respond to drugs. The illustration below shows a single nucleotide substitution in the DNA strand.

Steady state: When the rate of drug elimination equals the rate of administration.
Therapeutic index (TI): A quantitative measurement of the relative safety of a drug that compares the amount of drug that produces a therapeutic effect (ED50) with the amount of drug that produces a toxic effect (LD50). A medication with a large therapeutic index is safer than a medication with a small therapeutic index. TI= LD50/ED50.

Therapeutic window: The dosing window is the safe range between the minimum therapeutic concentration and the minimum toxic concentration of a drug; the range in which the most effective treatment will occur.
Ultra-rapid metabolizer: Metabolizing phenotype of individuals with substantially increased metabolic activity. Ultra-rapid metabolizers (UM) may experience a therapeutic failure when taking parent drugs (the drug does not have to be metabolized into a biologically active metabolite). Conversely, UMs may develop toxicities when prescribed a prodrug.

Zero-order kinetics: A process that describes how a drug's metabolism or elimination rate remains constant, regardless of the drug's concentration. In the graphs below, the figure on the right is a straight line. It reflects that the same amount of drug is eliminated across plasma concentrations. The second graph, showing drug concentration vs time, is a diagonal line with drug concentration decreasing over time.
