
1.5: Defining Nutrient Requirements- Dietary Reference Intakes
- Page ID
- 39945

\( \newcommand{\vecs}[1]{\overset { \scriptstyle \rightharpoonup} {\mathbf{#1}} } \)
\( \newcommand{\vecd}[1]{\overset{-\!-\!\rightharpoonup}{\vphantom{a}\smash {#1}}} \)
\( \newcommand{\id}{\mathrm{id}}\) \( \newcommand{\Span}{\mathrm{span}}\)
( \newcommand{\kernel}{\mathrm{null}\,}\) \( \newcommand{\range}{\mathrm{range}\,}\)
\( \newcommand{\RealPart}{\mathrm{Re}}\) \( \newcommand{\ImaginaryPart}{\mathrm{Im}}\)
\( \newcommand{\Argument}{\mathrm{Arg}}\) \( \newcommand{\norm}[1]{\| #1 \|}\)
\( \newcommand{\inner}[2]{\langle #1, #2 \rangle}\)
\( \newcommand{\Span}{\mathrm{span}}\)
\( \newcommand{\id}{\mathrm{id}}\)
\( \newcommand{\Span}{\mathrm{span}}\)
\( \newcommand{\kernel}{\mathrm{null}\,}\)
\( \newcommand{\range}{\mathrm{range}\,}\)
\( \newcommand{\RealPart}{\mathrm{Re}}\)
\( \newcommand{\ImaginaryPart}{\mathrm{Im}}\)
\( \newcommand{\Argument}{\mathrm{Arg}}\)
\( \newcommand{\norm}[1]{\| #1 \|}\)
\( \newcommand{\inner}[2]{\langle #1, #2 \rangle}\)
\( \newcommand{\Span}{\mathrm{span}}\) \( \newcommand{\AA}{\unicode[.8,0]{x212B}}\)
\( \newcommand{\vectorA}[1]{\vec{#1}} % arrow\)
\( \newcommand{\vectorAt}[1]{\vec{\text{#1}}} % arrow\)
\( \newcommand{\vectorB}[1]{\overset { \scriptstyle \rightharpoonup} {\mathbf{#1}} } \)
\( \newcommand{\vectorC}[1]{\textbf{#1}} \)
\( \newcommand{\vectorD}[1]{\overrightarrow{#1}} \)
\( \newcommand{\vectorDt}[1]{\overrightarrow{\text{#1}}} \)
\( \newcommand{\vectE}[1]{\overset{-\!-\!\rightharpoonup}{\vphantom{a}\smash{\mathbf {#1}}}} \)
\( \newcommand{\vecs}[1]{\overset { \scriptstyle \rightharpoonup} {\mathbf{#1}} } \)
\( \newcommand{\vecd}[1]{\overset{-\!-\!\rightharpoonup}{\vphantom{a}\smash {#1}}} \)
\(\newcommand{\avec}{\mathbf a}\) \(\newcommand{\bvec}{\mathbf b}\) \(\newcommand{\cvec}{\mathbf c}\) \(\newcommand{\dvec}{\mathbf d}\) \(\newcommand{\dtil}{\widetilde{\mathbf d}}\) \(\newcommand{\evec}{\mathbf e}\) \(\newcommand{\fvec}{\mathbf f}\) \(\newcommand{\nvec}{\mathbf n}\) \(\newcommand{\pvec}{\mathbf p}\) \(\newcommand{\qvec}{\mathbf q}\) \(\newcommand{\svec}{\mathbf s}\) \(\newcommand{\tvec}{\mathbf t}\) \(\newcommand{\uvec}{\mathbf u}\) \(\newcommand{\vvec}{\mathbf v}\) \(\newcommand{\wvec}{\mathbf w}\) \(\newcommand{\xvec}{\mathbf x}\) \(\newcommand{\yvec}{\mathbf y}\) \(\newcommand{\zvec}{\mathbf z}\) \(\newcommand{\rvec}{\mathbf r}\) \(\newcommand{\mvec}{\mathbf m}\) \(\newcommand{\zerovec}{\mathbf 0}\) \(\newcommand{\onevec}{\mathbf 1}\) \(\newcommand{\real}{\mathbb R}\) \(\newcommand{\twovec}[2]{\left[\begin{array}{r}#1 \\ #2 \end{array}\right]}\) \(\newcommand{\ctwovec}[2]{\left[\begin{array}{c}#1 \\ #2 \end{array}\right]}\) \(\newcommand{\threevec}[3]{\left[\begin{array}{r}#1 \\ #2 \\ #3 \end{array}\right]}\) \(\newcommand{\cthreevec}[3]{\left[\begin{array}{c}#1 \\ #2 \\ #3 \end{array}\right]}\) \(\newcommand{\fourvec}[4]{\left[\begin{array}{r}#1 \\ #2 \\ #3 \\ #4 \end{array}\right]}\) \(\newcommand{\cfourvec}[4]{\left[\begin{array}{c}#1 \\ #2 \\ #3 \\ #4 \end{array}\right]}\) \(\newcommand{\fivevec}[5]{\left[\begin{array}{r}#1 \\ #2 \\ #3 \\ #4 \\ #5 \\ \end{array}\right]}\) \(\newcommand{\cfivevec}[5]{\left[\begin{array}{c}#1 \\ #2 \\ #3 \\ #4 \\ #5 \\ \end{array}\right]}\) \(\newcommand{\mattwo}[4]{\left[\begin{array}{rr}#1 \amp #2 \\ #3 \amp #4 \\ \end{array}\right]}\) \(\newcommand{\laspan}[1]{\text{Span}\{#1\}}\) \(\newcommand{\bcal}{\cal B}\) \(\newcommand{\ccal}{\cal C}\) \(\newcommand{\scal}{\cal S}\) \(\newcommand{\wcal}{\cal W}\) \(\newcommand{\ecal}{\cal E}\) \(\newcommand{\coords}[2]{\left\{#1\right\}_{#2}}\) \(\newcommand{\gray}[1]{\color{gray}{#1}}\) \(\newcommand{\lgray}[1]{\color{lightgray}{#1}}\) \(\newcommand{\rank}{\operatorname{rank}}\) \(\newcommand{\row}{\text{Row}}\) \(\newcommand{\col}{\text{Col}}\) \(\renewcommand{\row}{\text{Row}}\) \(\newcommand{\nul}{\text{Nul}}\) \(\newcommand{\var}{\text{Var}}\) \(\newcommand{\corr}{\text{corr}}\) \(\newcommand{\len}[1]{\left|#1\right|}\) \(\newcommand{\bbar}{\overline{\bvec}}\) \(\newcommand{\bhat}{\widehat{\bvec}}\) \(\newcommand{\bperp}{\bvec^\perp}\) \(\newcommand{\xhat}{\widehat{\xvec}}\) \(\newcommand{\vhat}{\widehat{\vvec}}\) \(\newcommand{\uhat}{\widehat{\uvec}}\) \(\newcommand{\what}{\widehat{\wvec}}\) \(\newcommand{\Sighat}{\widehat{\Sigma}}\) \(\newcommand{\lt}{<}\) \(\newcommand{\gt}{>}\) \(\newcommand{\amp}{&}\) \(\definecolor{fillinmathshade}{gray}{0.9}\)How do we know how much of a given nutrient people should eat, or how much is too much? For this information, we can turn to the Dietary Reference Intakes (DRI)—a set of recommendations developed by the National Academies of Sciences, Engineering, and Medicine to describe the amounts of specific nutrients and energy that people should consume in order to stay healthy. They are developed by groups of nutrition scientists, who together evaluate the research to determine how much of a nutrient is required to prevent deficiencies and chronic disease, as well as how much is excessive and could cause toxicity. The DRI standards are specific to people living in the United States and Canada, and they’re meant to be used by people who are generally healthy, because those with specific health conditions may have different nutrient requirements.
The DRI standards can be divided into two main categories:
- Recommendations for energy intake – How many calories are required, and how much energy should proportionately come from carbohydrate, fat, and protein?
- Recommendations for nutrient intake – How much of each nutrient should be consumed, and how much is excessive?
We’ll discuss each of these categories, and then we’ll discuss some of the ways that the DRI standards are used. Be prepared to learn a lot of acronyms!
DRI Recommendations for Energy Intake
The DRIs include two types of recommendations related to energy intake:
1. Estimated Energy Requirement (EER). The EER is an estimate of how many calories a person needs to consume, on average, each day to stay healthy, based on their age, sex, height, weight, and physical activity level. For adults, the EER is meant to be a caloric intake that maintains energy balance, meaning that it won’t cause weight loss or gain. For children, the EER includes the energy needed for normal growth. For pregnant or lactating women, it includes energy needed for development of the fetus and other pregnancy requirements or for milk production. Different EER values were also developed for different physical activity levels, because greater physical activity requires more energy.1 The EER should be considered a “ballpark” estimate of a person’s caloric needs. As we’ll learn later in the term, the way that people process and utilize energy is highly variable, and two people can have the same sex, weight, height, and level of physical activity but different caloric needs.
2. Acceptable Macronutrient Distribution Ranges (AMDR). The AMDR is the calculated range of how much energy from carbohydrate, fat, and protein is recommended for a healthy diet. People who do not meet the AMDR may have increased risk of developing health complications—although these are also ballpark recommendations, not absolute requirements for health. Keep in mind that the percentage of daily caloric intake from the three energy-yielding macronutrients will add up to 100 percent, so the proportion of each influences the other two. For example, someone consuming a very low carbohydrate diet, with just 5 to 10 percent of calories coming from carbohydrates would not only fall short of the AMDR for carbohydrate but also exceed the recommended amounts of fat and/or protein, because the rest of daily calories must come from these macronutrients. The AMDR recommendations are based on balancing carbohydrate, fat, and protein to allow for adequate amounts of all three, and they are wide enough ranges that many different types of diets can fit within them.

Daily Recommendations for Nutrient Intake
There are four different types of DRI values used to describe recommendations for intake of individual nutrients:
- Estimated Average Requirements (EAR)
- Recommended Dietary Allowances (RDA)
- Adequate Intakes (AI)
- Tolerable Upper Intake Levels (UL)
DRI values are summarized in tables to make it easy to find a specific value for a person based on their life stage and sex. For example, part of a table of EAR values for macronutrients and vitamins is shown below.
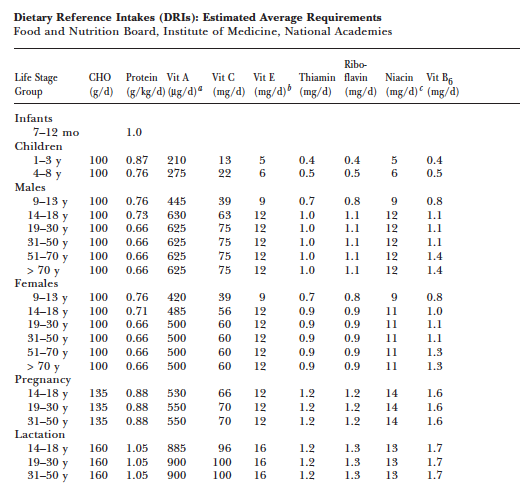
This page from the National Institutes of Health Office of Dietary Supplements provides links to DRI reports and tables: Nutrient Recommendations: Dietary Reference Intakes (DRI)
Let’s look at how each of these DRI values is determined, what they mean, and how they are used.
Estimated Average Requirement
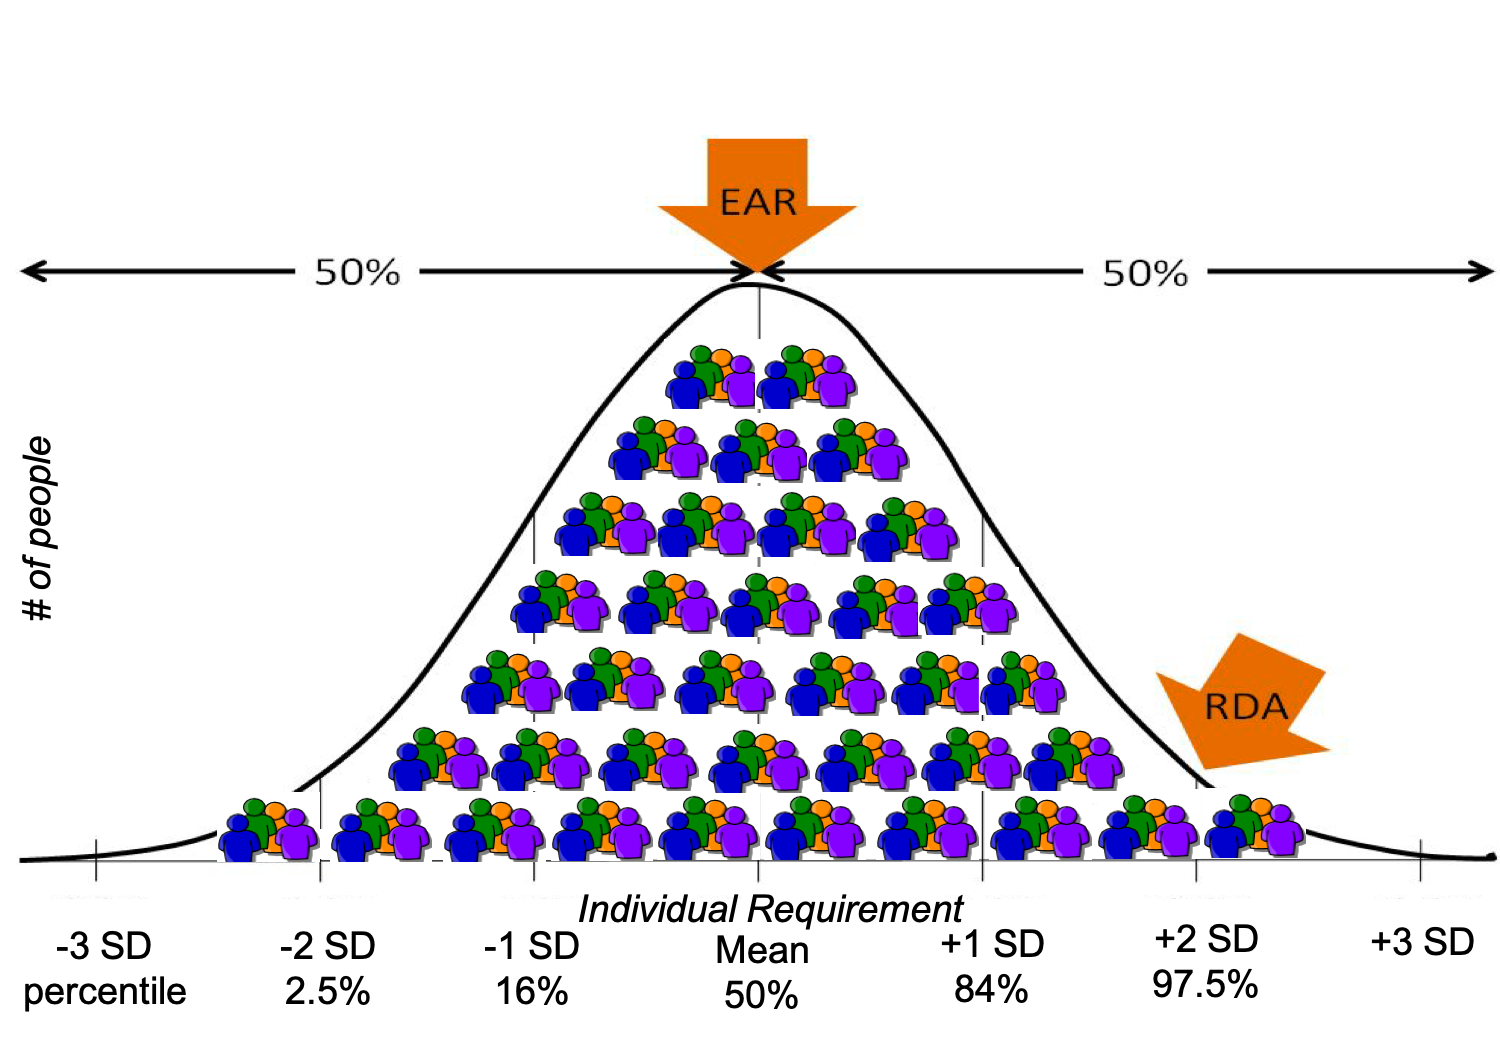
The Estimated Average Requirement (EAR) is the amount of a nutrient that meets the requirements of 50 percent of people within a group of the same life stage and sex. The requirements of half of the group will fall below the EAR, and the requirements of the other half will be above it. To understand the EAR, it’s important to recognize that individuals have different nutrient requirements, depending on many factors beyond our life stage and sex (differences in genetics, metabolism, body weight, and physical activity, for example), and the EAR is like the midpoint in the range of different individual requirements.
To develop the EAR, a committee of scientists evaluates the research on that nutrient and chooses a specific bodily function as a criterion on which to base it. For example, the EAR for calcium is set using a criterion of maximizing bone health, because this is quantitatively one of the most important functions of calcium, and the effects of different levels of calcium intake on bone health can be measured. Thus, the EAR for calcium is set at a point that will meet the needs, with respect to bone health, of half of the population.
The EAR for a given nutrient is shown in the graph below, with the individual requirement on the x-axis. Imagine this graph is depicting individual calcium requirements. The people on the left side of the graph have lower calcium requirements, and the people on the right side of the graph have higher calcium requirements. If everyone was eating the EAR for calcium, half would be getting enough calcium and half would not. Therefore, it wouldn’t be wise to recommend that everyone only consume the EAR, because about half of the population would fall short in calcium if this was set as the recommendation. EAR values are most important because they are used to calculate the Recommended Daily Allowance (RDA) values, which are commonly used as population-wide recommendations for nutrient intake.
Recommended Daily Allowances
Once the EAR of a nutrient has been established, the RDA value can be mathematically determined. While the EAR is set at a point that meets the needs of half the population, RDA values are set to meet the needs of the vast majority (97 to 98 percent) of the target healthy population. You can see this in the graph above. The RDA is a better recommendation for the population, because we can assume that if a person is consuming the RDA of a given nutrient, they are most likely meeting their nutritional needs for that nutrient.
This also explains why the RDA is not the same thing as an individual nutritional requirement. You may be consuming less than the RDA for calcium, but this does not automatically mean that your body is deficient in calcium and that you’ll definitely end up with osteoporosis, because your individual calcium requirement may be less than the RDA. However, since you probably don’t know your individual calcium requirement, the RDA is a good target amount for consumption, and the more your intake drops below the RDA, the greater your risk of later developing osteoporosis. The RDA is meant as a recommendation, and meeting the RDA means it is very likely that you are meeting your actual requirement for that nutrient.
It’s interesting to compare and contrast the EER (for energy or calorie intake) and the RDA (for nutrient intake). In practice, both types of recommendations serve as a daily target for intake. However, the EER is set to meet the average caloric needs of a person, while the RDA is set to meet the needs of the vast majority of the population. Imagine if the EER was set to ensure that it met the caloric needs of the vast majority of a population. It would end up being a dramatic overestimate of caloric needs for most people. If everyone actually followed this recommendation, the majority of them would consume far more calories than they actually needed, resulting in weight gain. For nutrients, we have more flexibility in our intake, because we have ways of storing or metabolizing and excreting excess nutrients, so consuming somewhat more than our body needs is just fine.
Adequate Intake
When there is insufficient scientific evidence to set an EAR and RDA for the entire population, then the National Academies committee can decide to set an Adequate Intake (AI) level instead. The AI is based on observing healthy people and seeing how much of the nutrient in question they are consuming. An AI is less precise than an RDA, but in the absence of an RDA, the AI is our best guess of how much of a given nutrient is needed. If there is not an RDA for a nutrient, than the AI is used as the nutrient-intake goal.
For example, there has not been sufficient scientific research into the exact nutritional requirements for infants. Consequently, all of the DRI values for infants are AIs derived from nutrient values in human breast milk. For older babies and young children, AI values are derived from human milk coupled with data on adults. The AI is meant for a healthy target group and is not meant to be sufficient for certain at-risk groups, such as premature infants.
Tolerable Upper Intake Levels
Consuming inadequate amount of nutrients can cause health problems, and we use the RDA or AI values as targets to ensure that we’re getting enough. However, consuming too much of many nutrients can also cause health problems. This is where the Tolerable Upper Intake Level (UL) is helpful. ULs indicate the highest level of continuous intake of a particular nutrient that may be taken without causing health problems.
It’s rare to find amounts of a nutrient exceeding the UL in a balanced diet based on whole foods. However, a person who consumes dietary supplements, foods fortified with high levels of additional nutrients (protein bars, for example) or a diet based on only a few foods, might exceed the UL, and this could cause problems with nutrient toxicity. If you’re selecting a supplement, be sure to choose one that does not exceed the UL for any nutrient, unless this is under specific instructions from your doctor or a registered dietitian.
When a nutrient does not have any known issue if taken in excessive doses, it is not assigned a UL. However, if a nutrient does not have a UL, that doesn’t necessarily mean that it is safe to consume in large amounts—only that there isn’t currently evidence that large amounts will cause problems. Science is an ongoing process, and the toxicity of many nutrients hasn’t yet been studied.
Putting It All Together
The graph below summarizes the meaning of the 4 DRI values for nutrient intake.
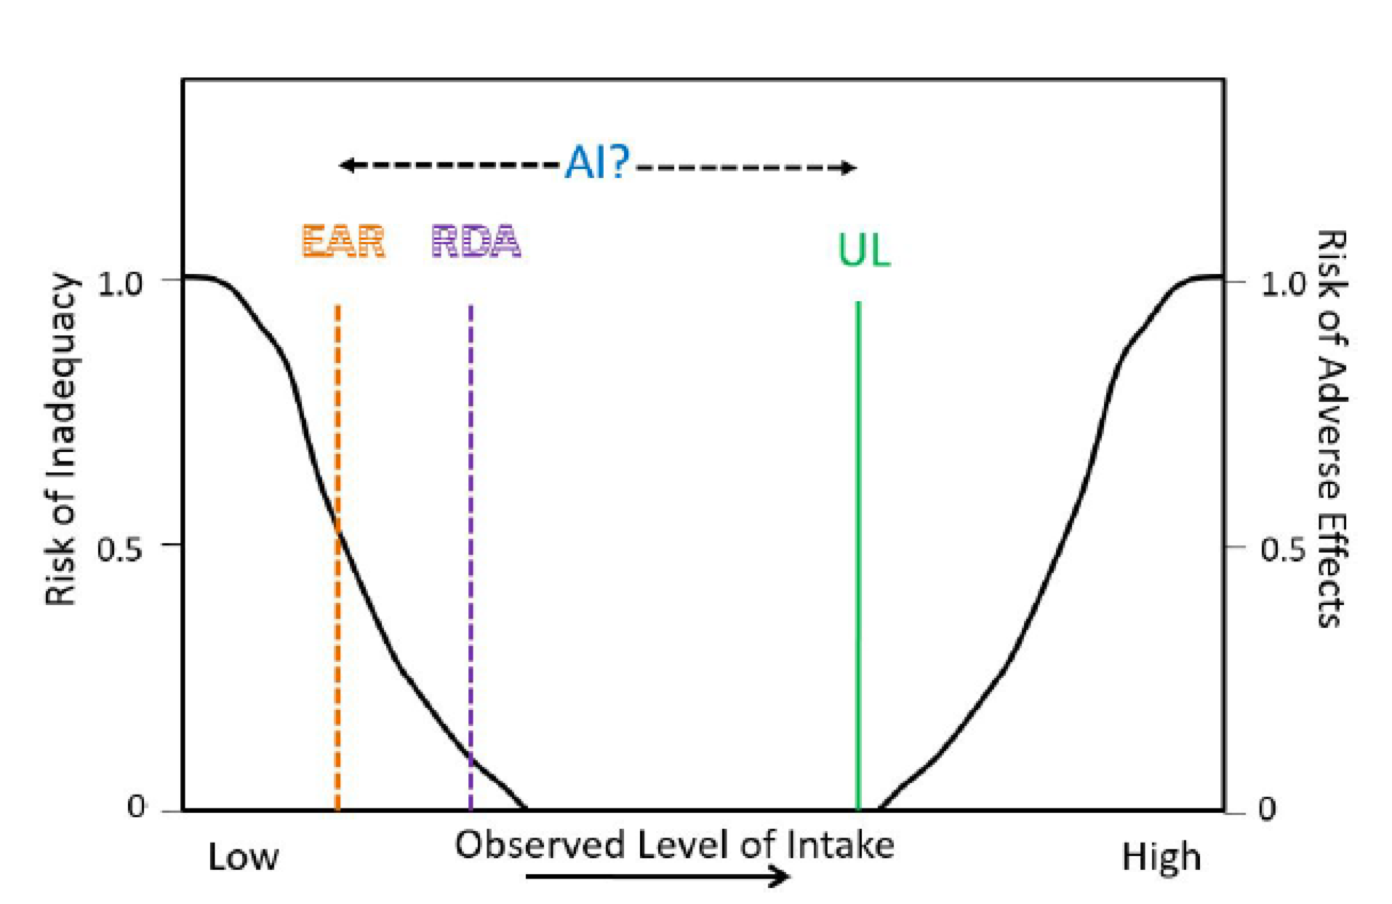
This graph shows the risks of nutrient inadequacy and nutrient excess as we move from a low intake of a nutrient to a high intake. Starting on the left side of the graph, you can see that when you have a very low intake of a nutrient, your risk of nutrient deficiency is high. As your nutrient intake increases, the chances that you will be deficient in that nutrient decrease. The point at which 50 percent of the population meets their nutrient needs is the EAR, and the point at which 97 to 98 percent of the population meets their needs is the RDA. The UL is the highest level at which you can consume a nutrient without it being too much. As nutrient intake increases beyond the UL, the risk of health problems resulting from that nutrient increases. The AI is shown to exist somewhere between the EAR and UL, as it’s an amount of the nutrient known to maintain health.
Note that there is a wide margin between the RDA and UL, showing that a person might safely eat much more than the RDA for a given nutrient without concerns of nutrient toxicity. However, be aware that the margin of safety varies depending on the nutrient. For example, fat-soluble vitamins have a smaller margin of safety between the RDA and the UL than water-soluble vitamins, meaning that it’s easier to consume toxic levels of fat-soluble vitamins.
How the DRIs are used
Individuals can use the DRIs to help assess and plan their diets. Keep in mind that the values established have been devised with an ample safety margin and should be used as guidance for optimal intakes. Also, the values are meant to assess and plan the average intake over time; that is, you don’t need to meet these recommendations every single day—meeting them over several days is sufficient.
The DRIs are also used by professionals, government agencies, and the food industry. Here are some examples of their applications2:
- Health professionals. Registered dietitians and other nutrition professionals use the DRIs to provide dietary counseling and education and to plan menus for institutions, such as hospitals, long-term care, prisons.
- Development of dietary guidelines. These include the U.S. Dietary Guidelines for Americans, MyPlate, and Canada’s Food Guide. In each case, developers ensure that their advice will help people meet the DRI standards.
- Nutrition labeling. The DRIs help to inform Nutrition Facts labels on foods and Supplement Facts on supplement labels.
- Assistance programs. School meals, WIC, SNAP, Child and Adult Care, and Administration on Aging programs must ensure that their programs align with the DRI.
- Nutrition monitoring research. Data from surveys of what people in the U.S. and Canada eat are compared with the DRIs to monitor national nutritional health.
- Military. The military uses the DRIs as a reference to ensure nutrient needs are met for the armed forces, to plan meals, and to procure military rations.
- Food and supplement industries. In the development of healthy food and safe supplement products, these industries should refer to the DRI.
Attributions:
- University of Hawai‘i at Mānoa Food Science and Human Nutrition Program, “Understand Daily Reference Intakes,” CC BY-NC 4.0.
References:
- 1Institute of Medicine, Food and Nutrition Board. (2005). Dietary Reference Intakes for Energy, Carbohydrate, Fiber, Fat, Fatty Acids, Cholesterol, Protein, and Amino Acids (Macronutrients). Washington, D.C.: The National Academies Press.
- 2The National Academies of Sciences, Engineering, and Medicine. Dietary Reference Intakes Tables and Application. Retrieved December 11, 2019, from Health and Medicine Division website: http://nationalacademies.org/hmd/Activities/Nutrition/SummaryDRIs/DRI-Tables.aspx
Image Credits:
- “People eating a meal around a table” by Priscilla Du Preez is in the Public Domain
- Figure 1.9. “Acceptable Macronutrient Distribution Ranges (AMDR)” by Alice Callahan is licensed under CC BY 4.0.
- Figure 1.10. “EAR and RDA relative to individual requirements for a given nutrient” by Alice Callahan is licensed under CC BY 4.0; edited from “Fig 8.43, Kansas State University Human Nutrition Flexbook” by Brian Lindshield is licensed under CC BY-NC-SA 4.0, with the addition of “small people 7 clip art” by Public Domain Clip Art in the Public Domain.
- Figure 1.11. DRI values for nutrient intake. “Fig 8.44, Kansas State University Human Nutrition Flexbook” by Brian Lindshield is licensed under CC BY-NC-SA 4.0