
10.6: Obesity Epidemic - Causes and Solutions
- Page ID
- 84919
\( \newcommand{\vecs}[1]{\overset { \scriptstyle \rightharpoonup} {\mathbf{#1}} } \)
\( \newcommand{\vecd}[1]{\overset{-\!-\!\rightharpoonup}{\vphantom{a}\smash {#1}}} \)
\( \newcommand{\id}{\mathrm{id}}\) \( \newcommand{\Span}{\mathrm{span}}\)
( \newcommand{\kernel}{\mathrm{null}\,}\) \( \newcommand{\range}{\mathrm{range}\,}\)
\( \newcommand{\RealPart}{\mathrm{Re}}\) \( \newcommand{\ImaginaryPart}{\mathrm{Im}}\)
\( \newcommand{\Argument}{\mathrm{Arg}}\) \( \newcommand{\norm}[1]{\| #1 \|}\)
\( \newcommand{\inner}[2]{\langle #1, #2 \rangle}\)
\( \newcommand{\Span}{\mathrm{span}}\)
\( \newcommand{\id}{\mathrm{id}}\)
\( \newcommand{\Span}{\mathrm{span}}\)
\( \newcommand{\kernel}{\mathrm{null}\,}\)
\( \newcommand{\range}{\mathrm{range}\,}\)
\( \newcommand{\RealPart}{\mathrm{Re}}\)
\( \newcommand{\ImaginaryPart}{\mathrm{Im}}\)
\( \newcommand{\Argument}{\mathrm{Arg}}\)
\( \newcommand{\norm}[1]{\| #1 \|}\)
\( \newcommand{\inner}[2]{\langle #1, #2 \rangle}\)
\( \newcommand{\Span}{\mathrm{span}}\) \( \newcommand{\AA}{\unicode[.8,0]{x212B}}\)
\( \newcommand{\vectorA}[1]{\vec{#1}} % arrow\)
\( \newcommand{\vectorAt}[1]{\vec{\text{#1}}} % arrow\)
\( \newcommand{\vectorB}[1]{\overset { \scriptstyle \rightharpoonup} {\mathbf{#1}} } \)
\( \newcommand{\vectorC}[1]{\textbf{#1}} \)
\( \newcommand{\vectorD}[1]{\overrightarrow{#1}} \)
\( \newcommand{\vectorDt}[1]{\overrightarrow{\text{#1}}} \)
\( \newcommand{\vectE}[1]{\overset{-\!-\!\rightharpoonup}{\vphantom{a}\smash{\mathbf {#1}}}} \)
\( \newcommand{\vecs}[1]{\overset { \scriptstyle \rightharpoonup} {\mathbf{#1}} } \)
\( \newcommand{\vecd}[1]{\overset{-\!-\!\rightharpoonup}{\vphantom{a}\smash {#1}}} \)
Obesity Trends
Obesity in the United States continues to escalate as seen in these maps from the Centers for Disease Control and Prevention. The methods used by the CDC to collect the data changed in 2011, so we can’t make direct comparisons between the periods before and after that change, but the trend has continued. Every year, more and more people in the U.S. are obese.


2022 Prevalence of Obesity Based on Self-Reported Weight and Height Among U.S. Adults by State and Territory "Prevalence of Obesity Based on Self-Reported Weight and Height Among U.S. Adults by State and Territory, BRFSS, 2022" by the Centers for Disease Control & Prevention Division of Nutrition, Physical Activity, and Obesity is in the Public Domain.
These trends are unmistakable, and they’re not just occurring in adults. Childhood obesity has seen similar increases over the last few decades—perhaps an even greater concern as the metabolic and health effects of carrying too much weight can be compounded over a person’s entire lifetime.
While obesity is a problem across the United States, it affects some groups of people more than others. Based on reports in 2021, obesity rates are higher among Hispanic (45.6 percent) and Black adults (49.9 percent) compared with white adults (41.4 percent). Non-Hispanic Asians have the lowest obesity rate (16.1 percent). And overall, people who are college-educated and have a higher income are less likely to be obese.1 These health disparities point to the importance of looking at social context when examining causes and solutions. Not everyone has the same opportunity for good health, or an equal ability to make changes to their circumstances, because of factors like poverty and longstanding inequities in how resources are invested in communities. These factors are called “social determinants of health.”2
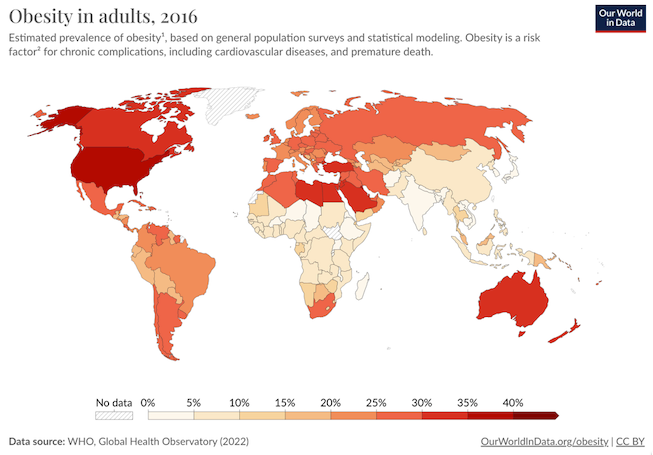
The obesity epidemic is also not unique to the United States. Obesity is rising around the globe and it was estimated to affect 2 billion people worldwide, making it one of the largest factors affecting poor health in most countries.3 Globally, among children aged 5 to 19 years old, the rate of overweight increased from 10.3 percent in 2000 to 18.4 percent in 2018. Previously, overweight and obesity mainly affected high-income countries, but some of the most dramatic increases in childhood overweight over the last decade have been in low income countries, such as those in Africa and South Asia, corresponding to a greater availability of inexpensive, processed foods.4
Despite the gravity of the problem, no country has yet been able to implement policies that have reversed the trend and brought about a decrease in obesity. This represents “one of the biggest population health failures of our time,” wrote an international group of researchers in the journal The Lancet in 2019.6 The World Health Organization has set a target of stopping the rise of obesity by 2025. Doing so requires understanding what is causing the obesity epidemic; it is only when these causes are addressed that change can start to occur.
Causes of the Obesity Epidemic
If obesity was an infectious disease sweeping the globe, affecting billions of people’s health, longevity, and productivity, we surely would have addressed it by now. Researchers and pharmaceutical companies would have worked furiously to develop vaccines and medicines to prevent and cure this disease. But the causes of obesity are much more complex than a single bacteria or virus, and solving this problem means recognizing and addressing a multitude of factors that lead to weight gain in a population.
Behavior
At its core, rising obesity is caused by a chronic shift towards positive energy balance—consuming more energy or calories than one expends each day, leading to an often gradual but persistent increase in body weight. People often assume that this is an individual problem, that those who weigh more simply need to change their behavior to eat less and exercise more, and if this doesn’t work, it must be because of a personal failing, such as a lack of self-control or motivation. While behavior patterns such as diet and exercise can certainly impact a person’s risk of developing obesity, the environments where we live also have a big impact on our behavior and can make it much harder to maintain energy balance.
Environment
Many of us live in what researchers and public health experts call “obesogenic environments.” That is, the ways in which our neighborhoods are built and our lives are structured influence our physical activity and food intake to encourage weight gain.7 Human physiology and metabolism evolved in a world where obtaining enough food for survival required significant energy investment in hunting or gathering—very different from today’s world where more people earn their living in sedentary occupations. From household chores, to workplace productivity, to daily transportation, getting things done requires fewer calories than it did in past generations.

Our jobs have become more and more sedentary, with fewer opportunities for non-exercise thermogenesis (NEAT) throughout the day. There’s less time in the school day for recess and physical activity, and fears about neighborhood safety limit kids’ ability to get out and play after the school day is over. Our towns and cities are built more for cars than for walking or biking. We can’t turn back the clock on human progress, and finding a way to stay healthy in obesogenic environments is a significant challenge.
Calculate your Walk Score
Check out how your neighborhood rates for commuting, public transportation and bike access at https://www.walkscore.com/score/
Our environments can also impact our food choices. We’re surrounded by vending machines, fast food restaurants, coffee shops, and convenience stores that offer quick and inexpensive access to calories. These foods are also heavily advertised, and especially when people are stretched thin by working long hours or multiple jobs, they can be a welcome convenience. However, they tend to be calorie-dense (and less nutrient-dense) and more heavily processed, with amounts of sugar, fat, and salt optimized to make us want to eat more, compared with home-cooked food. In addition, portion sizes at restaurants, especially fast food chains, have increased over the decades, and people are eating at restaurants more and cooking at home less.
Poverty and Food Insecurity
Living in poverty usually means living in a more obesogenic environment. Consider the fact that some of the poorest neighborhoods in the United States—with some of the highest rates of obesity—are often not safe or pleasant places to walk, play, or exercise. They may have busy traffic and polluted air, and they may lack sidewalks, green spaces, and playgrounds. A person living in this type of neighborhood will find it much more challenging to get adequate physical activity compared with someone living in a neighborhood where it’s safe to walk to school or work, play at a park, ride a bike, or go for a run.
In addition, poor neighborhoods often lack a grocery store where people can purchase fresh fruits and vegetables and basic ingredients necessary for cooking at home. Such areas are called “food deserts”—where healthy foods simply aren’t available or easily accessible.
Another concept useful in discussions of obesity risk is “food insecurity.” Food security means “access by all people at all times to enough food for an active, healthy life.”8 Food insecurity means an inability to consistently obtain adequate food. It may seem counter-intuitive, but in the United States, food insecurity is linked to obesity. That is, people who have difficulty obtaining enough food are more likely to become obese and to suffer from diabetes and hypertension. This is likely related to the fact that inexpensive foods tend to be high in calories but low in nutrients, and when these foods form the foundation of a person’s diet, they can cause both obesity and nutrient deficiencies.
Genetics
What about genetics? While it’s true that our genes can influence our susceptibility to becoming obese, researchers say they can’t be a cause of the obesity epidemic. Genes take many generations to evolve, and the obesity epidemic has occurred over just the last 40 to 50 years—only a few generations. When our grandparents were children, they were much less likely to become obese than our own children. That’s not because their genes were different, but rather because they grew up in a different environment. However, it is true that a person’s genes can influence their susceptibility to becoming obese in this obesogenic environment, and obesity is more prevalent in some families. A person’s genetic make-up can make it more difficult to maintain energy balance in an obesogenic environment, because certain genes may make you feel more hungry or slow your energy expenditure.1
Solutions to the Obesity Epidemic
Given the multiple causes of obesity, solving this problem will also require many solutions at different levels. Because obesity affects people over the lifespan and is difficult to reverse, the focus of many of these efforts is prevention, starting as early as the first years of life. We’ll discuss individual weight management strategies later in this chapter. Here, we’ll review some strategies happening in schools, communities, and at the state and federal levels.
Support Healthy Dietary Patterns
Interventions that support healthy dietary patterns, especially among people more vulnerable because of food insecurity or poverty, may reduce obesity. In some cases, studies have shown that they have an impact, and in other cases, it’s too soon to know. Here are some examples:
- Implement and support better nutrition standards for childcare, schools, hospitals, and worksites.9
- Limit marketing of processed foods, especially ads targeted towards children.
- Provide incentives for supermarkets or farmers markets to establish businesses in underserved areas.9
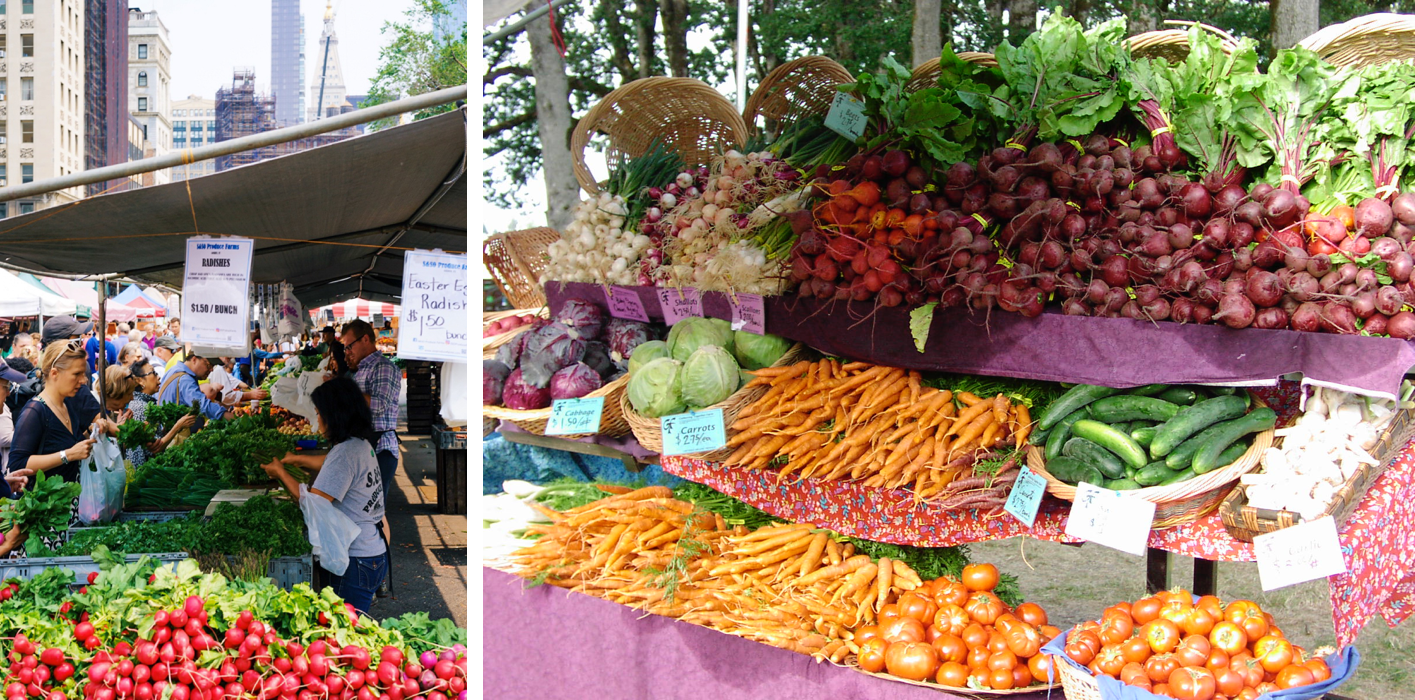
"group of people standing near vegetables" by Megan Bucknall is licensed under the standard Unsplash License; "Veggies at Corvallis Farmers Market" by Friends of Family Farmers is licensed under CC BY-ND 2.0.
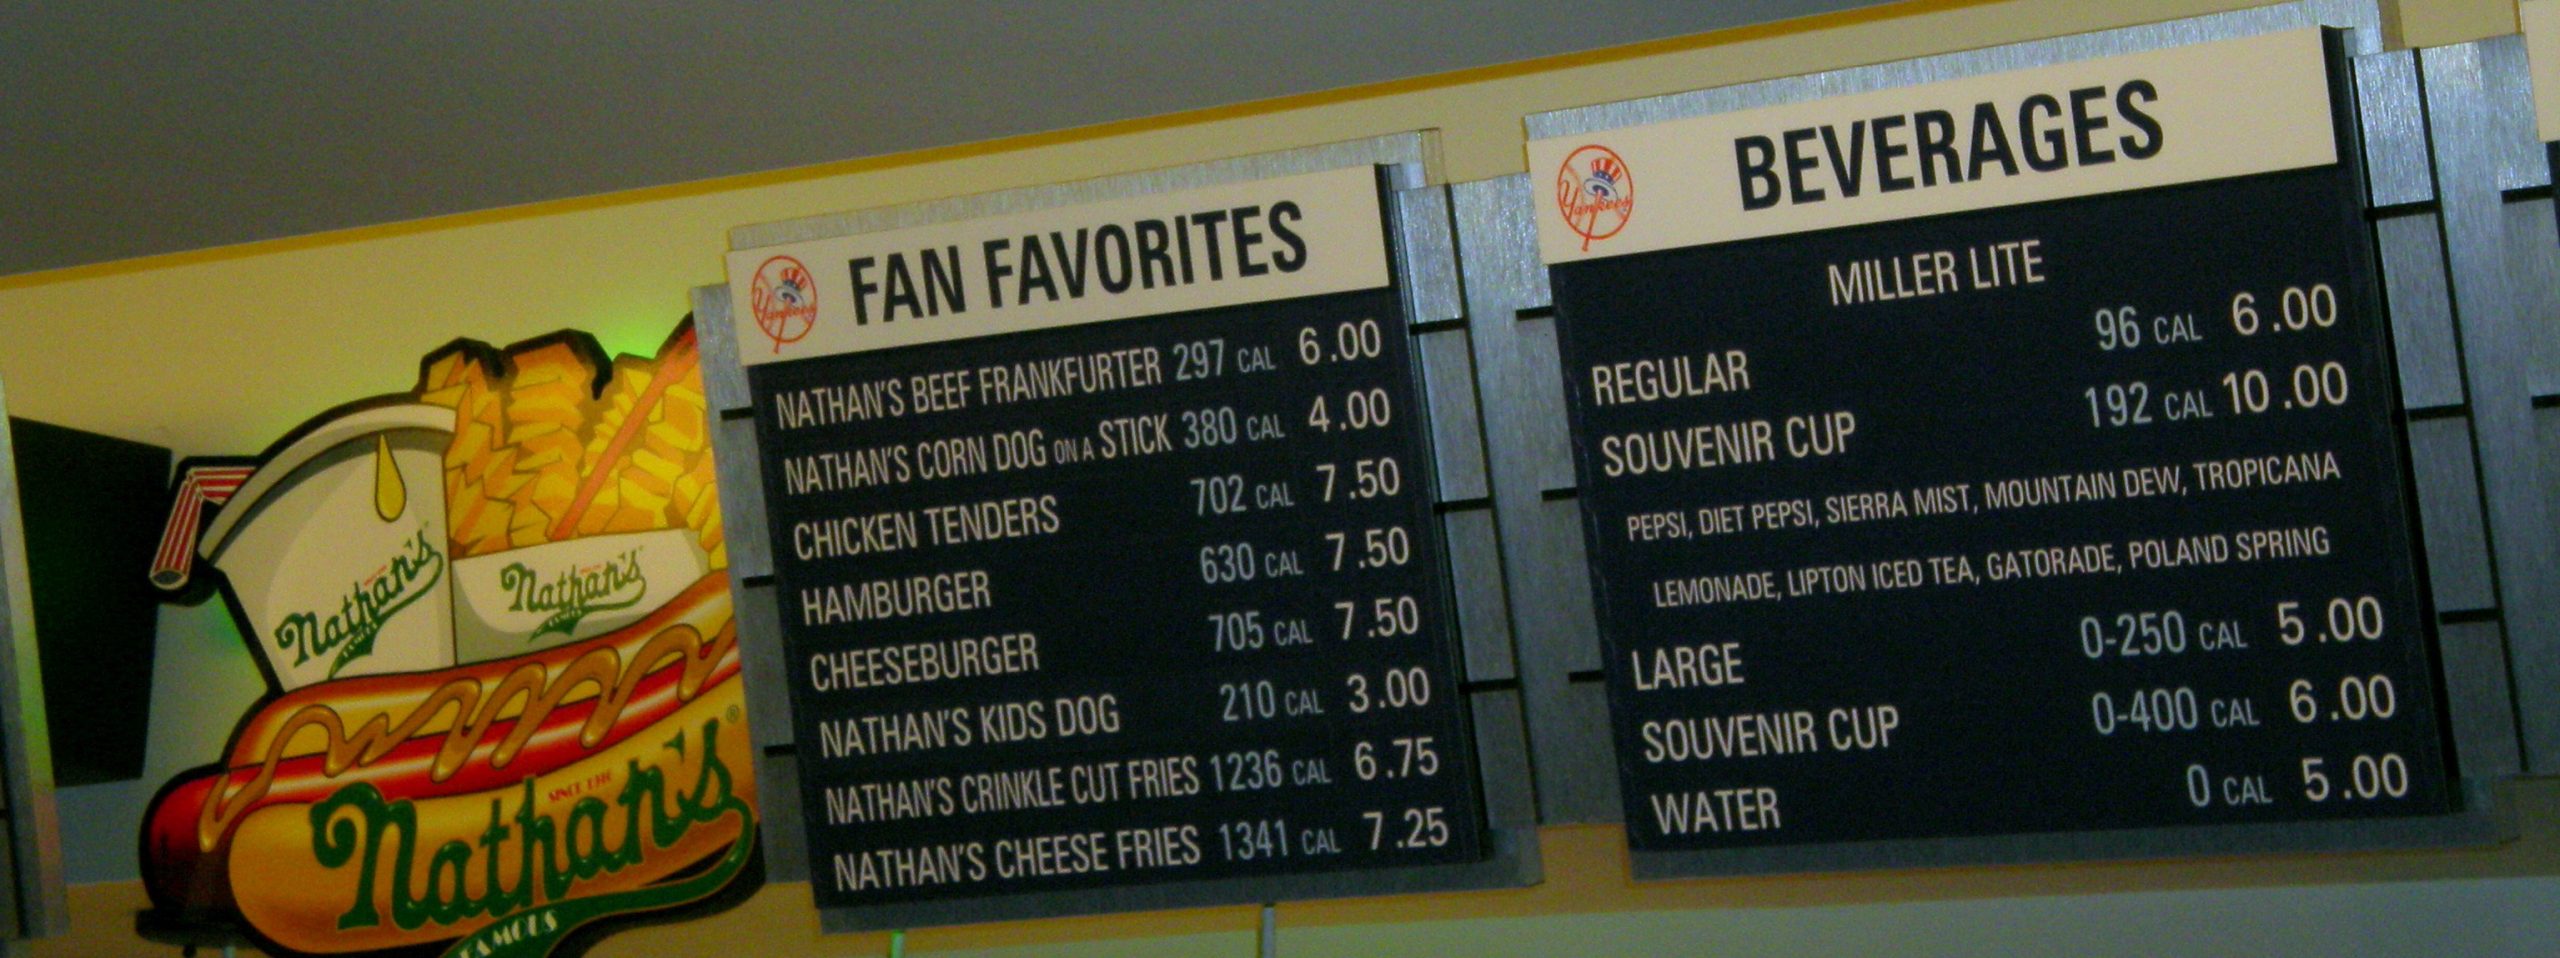
- Place nutrition and calorie content on restaurant and fast food menus to raise awareness of food choices.10 Beginning in 2018, as part of the Affordable Care Act, chain restaurants with more than 20 locations were required to add calorie information to their menus, and some had already done so voluntarily. There isn’t yet enough research to say whether having this information improves customers’ choices; some studies show an effect and others don’t.11 Many factors influence people’s decisions, and the type of restaurant, customer needs, and menu presentation all likely matter. For example, some studies show that health-conscious consumers choose lower calorie menu items when presented with nutrition information, but people with food insecurity may understandably choose higher calorie items to get more “bang for their buck”.12 Research has also shown that adding interpretative images—like a stoplight image labeling menu choices as green or red as shorthand for high or low nutrient density—can help. A 2018 study found that when calorie counts are on the left side of English-language menus, people order lower-calorie menu items. Putting calorie counts on the right side of the menu (as is more common) doesn’t have this effect, likely because the English language is read from left to right.13 Some studies have also found that restaurants that implement menu labeling offer lower-calorie and more nutrient-dense options, indicating that menu labeling may push restaurants to look more closely at the food they serve.11,14
- Increase access to food assistance programs and align them with nutrition recommendations. For example, in 2009, the U.S. Department of Agriculture revised the food packages for the Women, Infants, and Children (WIC) program to better align with the Dietary Guidelines for Americans. The new packages emphasized more fruits, vegetables, whole grains, and low-fat dairy and decreased the availability of juice. After this change, there was a decrease in the obesity rate of children in the WIC program. Similar progress may be made by increasing access to the Supplemental Nutrition Assistance Program (SNAP) in order to reduce food insecurity. Many farmers’ markets now accept SNAP benefits for the purchase of fresh fruit and vegetables.2
- Tax sugary drinks, such as soda and sports drinks, which contribute significant empty calories to the U.S. diet and are associated with childhood obesity. Local taxes on soda and other sugary drinks are often controversial, and soda companies lobby to prevent them from passing. However, early research in U.S. cities with soda taxes show that they do work to decrease soda consumption.2 In the U.S., soda has only been taxed at the local level, and the tax has been paid by consumers. The United Kingdom has taken a different approach: They started taxing soft drink manufacturers for the sugar content of the products they sell. Between 2015 and 2018, the average sugar content of soda sold in the U.K. dropped by 29 percent.14
Support Greater Physical Activity
Increasing physical activity increases the energy expended during the day. This can help maintain energy balance, thus preventing weight gain. It may also help to shift a person into negative energy balance and facilitate weight loss if needed. But simply adding an exercise session—a run or a trip to the gym, say—often doesn’t shift energy balance (though it’s certainly good for health). Why? Exercise can increase hunger, and there’s only so many calories a person can burn in 30 or 60 minutes. That’s why it’s also important to look for opportunities for non-exercise activity thermogenesis (NEAT); that is, find ways to increase movement throughout the day.
- Prioritize physical education and recess time in schools. In addition to helping kids stay healthy, movement also helps them learn.
- Make neighborhoods safer and more accessible for walking, cycling, and playing.
- When safe, encourage kids to walk or bike to school.
- Build family and community activities around physical activity, such as trips to the park, walks together, and community walking and exercise groups.
- Facilitate more movement in the workday by encouraging walking meetings, movement breaks, and treadmill desks.
- Find ways to move that are enjoyable to you and fit your life. Yard work, walking your dog, playing tag with your kids, and going out dancing all count!

"Early Bird" by Jorge Vasconez, "boy running to the future" by Rafaela Biazi, and "people riding bicycles in side bicycle lane beside skyscraper" by Steinar Engeland are all licensed under the standard Unsplash License.
References:
- Stierman B, Afful J, Carroll M, et al. National Health and Nutrition Examination Survey 2017–March 2020 Prepandemic Data Files Development of Files and Prevalence Estimates for Selected Health Outcomes. Natl Health Stat Report. 2021;158:1-21. doi:10.15620/cdc:106273.
- Trust for America’s Health. The State of Obesity: Better Policies for a Healthier America. Published 2019. Accessed November 2, 2023. https://www.tfah.org/report-details/stateofobesity2019/.
- Swinburn BA, Kraak VI, Allender S, et al. The global syndemic of obesity, undernutrition, and climate change: the Lancet Commission report. Lancet. 2019;393(10173):791-846. doi:10.1016/S0140-6736(18)32822-8.
- UNICEF. The State of the World's Children. 2019. Children, Food and Nutrition: Growing Well in a Changing World. Published October 2019. Accessed July 20, 2023. https://digitallibrary.un.org/record/3896035?ln=en.
- Ritchie H, Roser M. Obesity. Our World in Data. Published August 11, 2017. Accessed November 4, 2023. https://ourworldindata.org/obesity#:~:text=13%25%20of%20adults%20in%20the,of%20energy%20intake%20and%20expenditure.
- Jaacks LM, Vandevijvere S, Pan A, et al. The obesity transition: stages of the global epidemic. Lancet Diabetes Endocrinol. 2019;7(3):231-240. doi:10.1016/S2213-8587(19)30026-9.
- Townshend T, Lake A. Obesogenic environments: Current evidence of the built and food environments. Perspect Public Health. 2017;137(1):38–44. doi:10.1177/1757913916679860.
- Pan L, Sherry B, Njai R, Blanck HM. Food insecurity is associated with obesity among US adults in 12 states. J Acad Nutr Diet. 2012;112(9):1403–1409. doi:10.1016/j.jand.2012.06.011.
- Centers for Disease Control & Prevention. Community Efforts. cdc.gov. Updated May 24, 2023. Accessed October 30, 2019. https://www.cdc.gov/obesity/strategies/community.html.
- Bleich SN, Economos CD, Spiker ML, et al. A systematic review of calorie labeling and modified calorie labeling interventions: impact on consumer and restaurant behavior. Obesity. 2017;25(12):2018–2044. doi:10.1002/oby.21940.
- Berry C, Burton S, Howlett E, Newman CL. Understanding the calorie labeling paradox in chain restaurants: why menu calorie labeling alone may not affect average calories ordered. J Public Policy Mark. 2019;38(2):192–213. doi:10.1177/0743915619827013.
- Dallas SK, Liu PJ, Ubel PA. Don’t count calorie labeling out: calorie counts on the left side of menu items lead to lower calorie food choices. J Consum Pyschol. 2019;29(1):60–69. doi:10.1002/jcpy.1053.
- Theis DRZ, Adams J. Differences in energy and nutritional content of menu items served by popular UK chain restaurants with versus without voluntary menu labelling: A cross-sectional study. PLOS ONE. 2019;14(10):e0222773. doi:10.1371/journal.pone.0222773.
- Public Health England. Sugar reduction: Report on progress between 2015 and 2018. Published September 2019. Accessed November 9, 2023. https://assets.publishing.service.gov.uk/government/uploads/system/uploads/attachment_data/file/832182/Sugar_reduction__Yr2_progress_report.pdf.
- NOVA’s Secret Life of Scientists and Engineers. James Levine: "I Came Alive as a Person" [Video]. YouTube. https://youtu.be/fLgGf0BO4tw?si=PST2icpzlLovdEJX. Published April 24, 2014. Accessed November 10, 2023.