
1.1: What is Epidemiology?
- Page ID
- 92509

\( \newcommand{\vecs}[1]{\overset { \scriptstyle \rightharpoonup} {\mathbf{#1}} } \)
\( \newcommand{\vecd}[1]{\overset{-\!-\!\rightharpoonup}{\vphantom{a}\smash {#1}}} \)
\( \newcommand{\dsum}{\displaystyle\sum\limits} \)
\( \newcommand{\dint}{\displaystyle\int\limits} \)
\( \newcommand{\dlim}{\displaystyle\lim\limits} \)
\( \newcommand{\id}{\mathrm{id}}\) \( \newcommand{\Span}{\mathrm{span}}\)
( \newcommand{\kernel}{\mathrm{null}\,}\) \( \newcommand{\range}{\mathrm{range}\,}\)
\( \newcommand{\RealPart}{\mathrm{Re}}\) \( \newcommand{\ImaginaryPart}{\mathrm{Im}}\)
\( \newcommand{\Argument}{\mathrm{Arg}}\) \( \newcommand{\norm}[1]{\| #1 \|}\)
\( \newcommand{\inner}[2]{\langle #1, #2 \rangle}\)
\( \newcommand{\Span}{\mathrm{span}}\)
\( \newcommand{\id}{\mathrm{id}}\)
\( \newcommand{\Span}{\mathrm{span}}\)
\( \newcommand{\kernel}{\mathrm{null}\,}\)
\( \newcommand{\range}{\mathrm{range}\,}\)
\( \newcommand{\RealPart}{\mathrm{Re}}\)
\( \newcommand{\ImaginaryPart}{\mathrm{Im}}\)
\( \newcommand{\Argument}{\mathrm{Arg}}\)
\( \newcommand{\norm}[1]{\| #1 \|}\)
\( \newcommand{\inner}[2]{\langle #1, #2 \rangle}\)
\( \newcommand{\Span}{\mathrm{span}}\) \( \newcommand{\AA}{\unicode[.8,0]{x212B}}\)
\( \newcommand{\vectorA}[1]{\vec{#1}} % arrow\)
\( \newcommand{\vectorAt}[1]{\vec{\text{#1}}} % arrow\)
\( \newcommand{\vectorB}[1]{\overset { \scriptstyle \rightharpoonup} {\mathbf{#1}} } \)
\( \newcommand{\vectorC}[1]{\textbf{#1}} \)
\( \newcommand{\vectorD}[1]{\overrightarrow{#1}} \)
\( \newcommand{\vectorDt}[1]{\overrightarrow{\text{#1}}} \)
\( \newcommand{\vectE}[1]{\overset{-\!-\!\rightharpoonup}{\vphantom{a}\smash{\mathbf {#1}}}} \)
\( \newcommand{\vecs}[1]{\overset { \scriptstyle \rightharpoonup} {\mathbf{#1}} } \)
\(\newcommand{\longvect}{\overrightarrow}\)
\( \newcommand{\vecd}[1]{\overset{-\!-\!\rightharpoonup}{\vphantom{a}\smash {#1}}} \)
\(\newcommand{\avec}{\mathbf a}\) \(\newcommand{\bvec}{\mathbf b}\) \(\newcommand{\cvec}{\mathbf c}\) \(\newcommand{\dvec}{\mathbf d}\) \(\newcommand{\dtil}{\widetilde{\mathbf d}}\) \(\newcommand{\evec}{\mathbf e}\) \(\newcommand{\fvec}{\mathbf f}\) \(\newcommand{\nvec}{\mathbf n}\) \(\newcommand{\pvec}{\mathbf p}\) \(\newcommand{\qvec}{\mathbf q}\) \(\newcommand{\svec}{\mathbf s}\) \(\newcommand{\tvec}{\mathbf t}\) \(\newcommand{\uvec}{\mathbf u}\) \(\newcommand{\vvec}{\mathbf v}\) \(\newcommand{\wvec}{\mathbf w}\) \(\newcommand{\xvec}{\mathbf x}\) \(\newcommand{\yvec}{\mathbf y}\) \(\newcommand{\zvec}{\mathbf z}\) \(\newcommand{\rvec}{\mathbf r}\) \(\newcommand{\mvec}{\mathbf m}\) \(\newcommand{\zerovec}{\mathbf 0}\) \(\newcommand{\onevec}{\mathbf 1}\) \(\newcommand{\real}{\mathbb R}\) \(\newcommand{\twovec}[2]{\left[\begin{array}{r}#1 \\ #2 \end{array}\right]}\) \(\newcommand{\ctwovec}[2]{\left[\begin{array}{c}#1 \\ #2 \end{array}\right]}\) \(\newcommand{\threevec}[3]{\left[\begin{array}{r}#1 \\ #2 \\ #3 \end{array}\right]}\) \(\newcommand{\cthreevec}[3]{\left[\begin{array}{c}#1 \\ #2 \\ #3 \end{array}\right]}\) \(\newcommand{\fourvec}[4]{\left[\begin{array}{r}#1 \\ #2 \\ #3 \\ #4 \end{array}\right]}\) \(\newcommand{\cfourvec}[4]{\left[\begin{array}{c}#1 \\ #2 \\ #3 \\ #4 \end{array}\right]}\) \(\newcommand{\fivevec}[5]{\left[\begin{array}{r}#1 \\ #2 \\ #3 \\ #4 \\ #5 \\ \end{array}\right]}\) \(\newcommand{\cfivevec}[5]{\left[\begin{array}{c}#1 \\ #2 \\ #3 \\ #4 \\ #5 \\ \end{array}\right]}\) \(\newcommand{\mattwo}[4]{\left[\begin{array}{rr}#1 \amp #2 \\ #3 \amp #4 \\ \end{array}\right]}\) \(\newcommand{\laspan}[1]{\text{Span}\{#1\}}\) \(\newcommand{\bcal}{\cal B}\) \(\newcommand{\ccal}{\cal C}\) \(\newcommand{\scal}{\cal S}\) \(\newcommand{\wcal}{\cal W}\) \(\newcommand{\ecal}{\cal E}\) \(\newcommand{\coords}[2]{\left\{#1\right\}_{#2}}\) \(\newcommand{\gray}[1]{\color{gray}{#1}}\) \(\newcommand{\lgray}[1]{\color{lightgray}{#1}}\) \(\newcommand{\rank}{\operatorname{rank}}\) \(\newcommand{\row}{\text{Row}}\) \(\newcommand{\col}{\text{Col}}\) \(\renewcommand{\row}{\text{Row}}\) \(\newcommand{\nul}{\text{Nul}}\) \(\newcommand{\var}{\text{Var}}\) \(\newcommand{\corr}{\text{corr}}\) \(\newcommand{\len}[1]{\left|#1\right|}\) \(\newcommand{\bbar}{\overline{\bvec}}\) \(\newcommand{\bhat}{\widehat{\bvec}}\) \(\newcommand{\bperp}{\bvec^\perp}\) \(\newcommand{\xhat}{\widehat{\xvec}}\) \(\newcommand{\vhat}{\widehat{\vvec}}\) \(\newcommand{\uhat}{\widehat{\uvec}}\) \(\newcommand{\what}{\widehat{\wvec}}\) \(\newcommand{\Sighat}{\widehat{\Sigma}}\) \(\newcommand{\lt}{<}\) \(\newcommand{\gt}{>}\) \(\newcommand{\amp}{&}\) \(\definecolor{fillinmathshade}{gray}{0.9}\)Learning Objectives
By the end of this chapter, the learner will be able to
- Define and understand the field of epidemiology
- List the areas of study in epidemiology
- Understand epidemiology as an interdisciplinary science
- List the main uses of epidemiology in public health and social sciences
- Explain how the field of epidemiology started and its contributions to the study of causality and disease
What is epidemiology?
The field of epidemiology is relatively a new science, at the point that sometimes (probably frequently), it is better understood in the context of another field of study, biostatistics. But epidemiology has its own terminology, and also its own methodology that make it a little different, if not very different from biostatistics.[1]
Epidemiology Definition
It is accepted that epidemiology is the science to understand, and explain the occurrences of health phenomena in a population. As a branch of public health, epidemiology studies not only disease, but also different health outcomes. [2]
Epidemiology: an interdisciplinary science
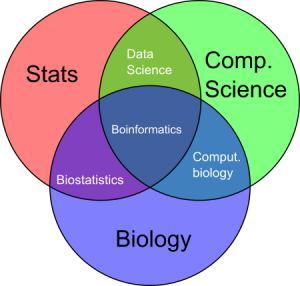
Since epidemiology integrates several aspects of the social sciences, and at the same time uses information, and tools from other sciences, that is the reason to consider, epidemiology as a interdisciplinary science. It takes information from statistics, medicine, biology, sociology, nutrition, cultural studies, gender studies, anthropology, etc., and integrates them into the production of models, formulas, and analyses that can be used to predict, prevent, and analyze many health phenomena, including the issue of quality of life, and wellness. Its contributions are vast, because of its interdisciplinary nature.[3] At the same time for epidemiology to be interdisciplinary brings some complications, since there is no way that results are free of errors; but as a science that auto-correct through trial and error, make it stronger for advancement.[4]
See an image (representation) of how interdisciplinary sciences work for a degree in bioinformatics.
The list of uses of epidemiology included in this book does not pretend to be exhaustive. There are probably more uses that have not been listed here but they can be found in the medical and public health literature.
Key Takeaways – Epidemiology is used to
- Predict and prevent adverse (or, positive) health outcomes
- collect information, and track different health outcomes
- To study infectious diseases and also chronic diseases
- For the planning of health services
- And others that had been listed above in this section.
Epidemiology and its beginnings
In addition, all of the mentioned uses and applications of epidemiology since its beginnings, epidemiology has greatly contributed to studying disease causality in medicine and public health.
The initial models of causality.
The most common models are discussed in this chapter. And, the applications of most of the terms will be covered in a brief chapter dedicated to infectious diseases later in the book.
Approaches used to explain causality
The history of epidemiology is linked to the causality model commonly used in the study of infectious diseases. And, one of the initial approaches used to explain causality is the interaction between host, agent, and environment.
The epidemiological triangle
In many ways, epidemiology started with the famous epidemiological triangle, which is an old model to explain causality. In this concept, for disease to occur, there is need to have a host, an agent, and an environment.[5] This explanation holds true for a long time in sciences, and at a certain point, the variable, time was added, in order to add a new dimension, which means, host, agent and environment occur in a specific time that can be minutes, hours, days, etc.

In so many ways, this model holds true for infectious diseases because it is based on the medical model to explain causality. The situation changes when these concepts are applied to the causality of non infectious diseases, in which the interaction of so many other factors, some of them very unpredictable cannot be explained by this concept of the epidemiological triangle. But for now, in this chapter, we will use the model to introduce the concepts, and definitions commonly used in epidemiology.[6]
Key Takeaways (Sidebar)
The agent
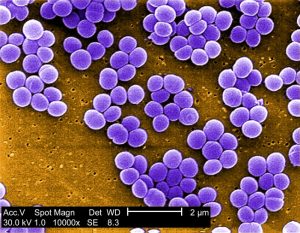
It is accepted that the agent is one of the major causal factors – and of course – in this medical model, common agents include (what we know so far in sciences): bacteria, viruses, fungi, other microbes and parasites. Another common name for the agent, is pathogen.pathogen. Examples of common agents, bacteria. See picture below:
The host
In the context of the epidemiological triangle, a host can be a person or an animal that harbors the disease. As described later in the textbook, a host can show symptoms of the disease or can be free of symptoms.

The environment
In general, it is accepted that the environment is everything that surrounds the host or promotes the existence of the agent. It is the external (to the host or, agent) set of factors that contribute to the development of the disease.

Time
It refers to the duration of the disease, it includes incubation periods (no symptoms are manifested during this period), or the manifestation of the whole set of symptoms that characterize the disease.

Other models to explain causation in epidemiology
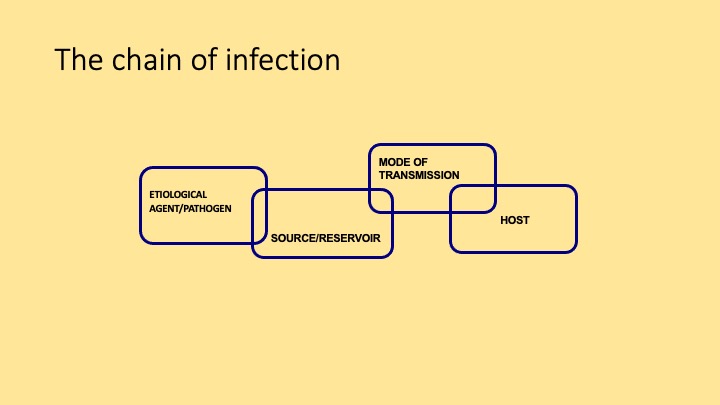
There is another model commonly used in epidemiology, which is very similar to the epidemiological triangle, and this is called, the ‘Chain of Infection.’ Again, the model works well for infectious diseases but not for other types of diseases or disorders.
The chain of infection model
In the chain of infection model, the main factors that contribute to disease development are the same, but they seem to be more developed, for example, the agent/pathogen is called, etiologic agent/pathogen; there is the addition of another category called, the source/reservoir, mode of transmission, and host. See image:
The improved model
Over the years, the chain of infection model has been expanded and some of the components [although they are essentially the same as the original conceptualization of the model], they appear listed independently, for example, the mode of transmission remains, but two new concepts added, the ‘means of entry‘ and the ‘means of escape’ – which are essentially related to the ‘mode’ of transmission. Also, the ‘host susceptibility’ has been added too, and the word, ‘organism‘ has been added to the the word ‘pathogen,’ creating a category known as the ‘pathogenic organism. The reservoir category remained unchanged. See the image that represents the model:

Benefits of the two models – epidemiological triangle, and chain of infection
It is fair to ask: how do these models help to understand causality in epidemiology?
The answer to this question is that these models complement each other or expand on the concepts used to explain how disease transmission occurs. There is a lot details involved in the implementation of this model, but for this section, the major concepts have been discussed. It is also important to note that with the COVID-19 pandemic, many of these concepts have resurged because the pandemic is caused by an infectious disease agent.[7]
The newly developed epidemiological triangle
In the context of this section, here is how the concepts presented above have contributed to the ‘newly improved epidemiological triangle,’ which is presented below:
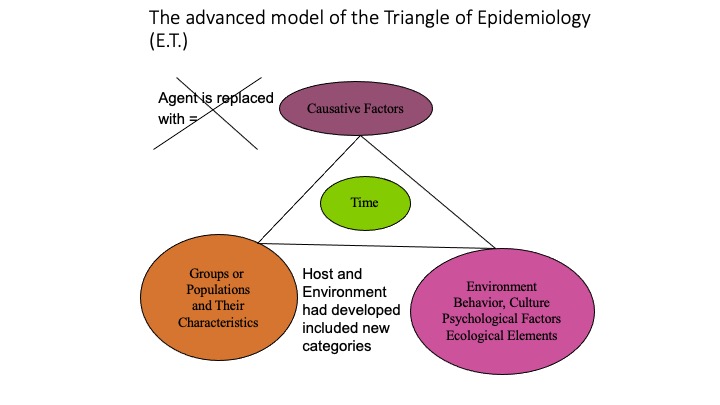
The epidemiological triangle is considered foundational to the field of epidemiology, it is limited (very basic) and only applies to infectious and other communicable diseases. For this reason, the need to develop more advanced models has been the basis to develop another concept, which is the web of causation.
The concept of the web of causation
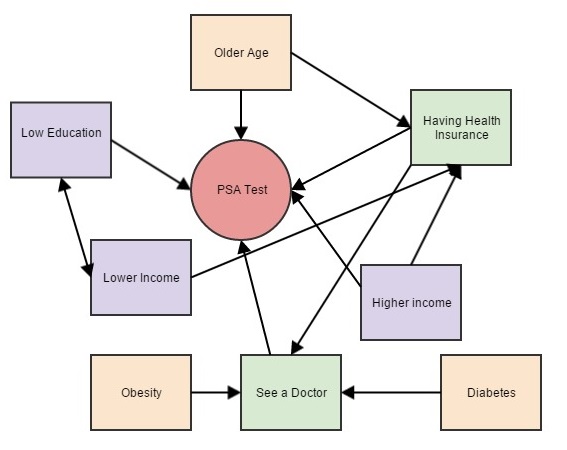
The main premise of this approach is that there is more than one factor involved in the development of what we call, ‘disease.’ It is a series of factors that are involved in this process, it is multifactorial. multifactorial And, when the several factors are put together, the model looks more like a web -hence the name, web of causation. One example could be the case of the use of prostate-specific antigen (PSA) test used to assess if a man needs or, does not cancer treatment, especially unnecessary cancer treatment. [8] See image below:
The concept of Health Determinants
Although the web of causation (also called, the ‘web of causality’) is very useful, but when there is time to operationalize the multitude of factors involved in the process. Most models fall short because it is more than the interaction between an agent, a host, and an environment, and even if the concepts are expanded such as in the case of the chain of infection model. There is a need to integrate the concepts of risk factors and other several factors that affect the health of the individual and the community in a direct and indirect forms. The concept of health determinants is depicted in the following image:

In general social determinants are conditions in the places where people live, learn, work, and play that affect a wide range of health and quality-of life-risks and outcomes. [9] This approach is being found useful, especially to understand how health and disease are dynamic concepts that go beyond the identification of agents/pathogens, host characteristics, and the environment. On the other hand, and to be fair, the previous (‘older’) models can still be seen in this new model, especially that expansion on the concept of environment, and its associated factors.
Additional Common Epidemiological concepts
In this section of the chapter, the following concepts will be defined and explained: epidemic, endemic, pandemic, holoendemic, and others.
Epidemic
The term epidemic in general refers to an increase in the frequency of a disease (the term applies mostly to infectious diseases, although in recent years, it is common to hear the use of the term for non infectious diseases such as obesity). Or, put in another way, epidemic refers to an ‘excess’ in the number of cases of a disease. See a general graph (or pattern) of an epidemic:
There are several definitions of epidemic found on the Internet, but most of them are confusing. The key concept is the word, ‘excess’ which also means that there is a baseline in the occurrence of the disease, and once the baseline grows, the epidemic has started. The graph shows how the number of cases ascends (or, increases).

At the same time, it is common for newly epidemiology students to confuse the term, ‘seasonal disease’ (explained later in this section) with an epidemic disease. But the difference is that a seasonal disease occurs during certain seasons, or, times of the year, and then, it declines. A common example is the seasonal flu, which usually starts in early October and ends around April or, May. Then, the number of cases declines significantly (almost disappears) during the summer months usually June – August. See a graphic representation of a seasonal disease such as the flu.
Another common term, especially in these days of COVID-19, it is pandemic. Since a pandemic is a disease that after being epidemic has crossed borders and become a health problem across the world, see an image of this below from the 2009 swine flu pandemic:

There is also a typical (classic) shape of a pandemic, which compared to the graph on an epidemic (see, epidemic here in this chapter), the pandemic comes (goes) in waves, and the entire process passed, it resembles the shape of a ‘W’ letter. See image below:

Another image that reinforce the comments about the ‘pandemic goes in waves,’ can be seen below:

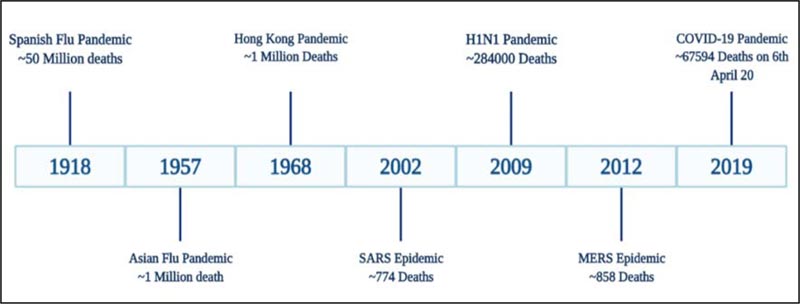
Another characteristic is that pandemic tends to appears every one hundred years, or, closer to one hundred years from the last pandemic as is the case of the Spanish flu. Epidemiologists use this type of information to compare and predict current and future pandemics. See the image below from :
An additional concept that usually is discussed in this context, is the concept of endemic, which essentially refers to a disease with a constant frequency that is limited to a specific area or region in the world. An example of an endemic disease for example in tropical regions, or, countries in the world is malaria, which is ‘endemic’ for example in some regions of Africa and Latin America, see image below:

Finally, an additional terms is also part of the list of concept discussed here, there are two terms, hyperendemic and holoendemic. The use of these terms is infrequent, but it probably helps to understand that a combination of terms is also possible.
Other terms and concepts used in epidemiology
The following is a section that covers other concepts and terms commonly used as the foundations of epidemiology, especially for understanding infectious diseases. They may not apply to non-infectious conditions since this is part of the original model of epidemiology as it has been mentioned several times in this textbook.
The natural course of a disease
Every disease follows a natural course from start to finish, known as its natural history. If no medical intervention is introduced, the disease will run its full course. Epidemiology, the study of diseases, was originally developed under the medical model. Some diseases have a well-documented natural history, while others are not well understood. The image below provides a summary of the key components of this model.
This model (of the natural history of disease) has been used to develop the concepts of primary, secondary, and tertiary prevention that are commonly used in medicine, public health, and especially in public health education. And this makes sense if the model is again applied to an infectious, or, communicable disease.
The susceptible host matches the majority of situations known as primary prevention which is composed of a series of interventions, mainly medical and public health actions that help to prevent diseases, for example, the use of a pap smear to prevent and detect early stages of cervical cancer, mammograms, digital rectal exams, colonoscopies, and other common screening tests. The idea is to identify the risk, of, the disease in an early stage mostly before symptoms develop. When the symptoms start developing, and the person seeks a health care provider, then, the step is referred to as, secondary preventionthis is the most expensive stage because the cases that are serious or, need intense treatment are hospitalized to receive a more intensive intervention, those cases that are not hospitalized are usually given treatment under supervision especially for middle cases of a disease. The last step is called, tertiary prevention,
In this step, the person recovers, dies, becomes disabled, or, with severe limitations such as in the case of after a stroke in which most affected individuals have problems with speech, and walking to just mention some of the complications of an after a stroke episode. This phase is commonly misunderstood because many people see rehabilitation as part of the secondary prevention in which only medical care professionals provide services to rehabilitate the affected individual, but in general, going beyond the medical model, rehabilitation is more than just medical care, many times it means, helping the affected individual to improve the quality of life and to come back to society in a productive manner.
In addition, the following table goes into more detail and provide examples that should help to understand the above-mentioned concepts:

The levels of prevention can be linked to the clinical model, and this helps to put into context the common medical and public health interventions that most people use to be seen as part of the work of the medical and public health work.
See a summary of this comparison in the following table:
| In the clinical model, there are three levels of healthcare services | From the clinical model, three level of prevention have emerged |
|---|---|
| Primary care | Primary prevention |
| Secondary care | Secondary prevention |
| Tertiary care | Tertiary prevention |
Important comments about the information above
The above distinctions should help public health professionals in training, especially health educators to better understand the differences between the levels of care and the level of prevention, especially for students who are not familiar with the United States healthcare system. This system works differently in other parts of the world, especially in developing countries. So, the comparison should also help to conciliate the differences.
Summary of the chapter
This chapter has intended to give the student among other things, an overview of the field of epidemiology, what is it, and how it works. Also, it had covered most common concepts used in epidemiology; most of these concepts will be integrated with the content of several of the chapters that made the book.
- No Author. (n.d.). Epidemiology vs. Biostatistics: Understanding Their Roles in Public Health. University of Nevada Reno. Available at: https://onlinedegrees.unr.edu/blog/epidemiology-vs-biostatistics/↵
- Hernandez JBR, Kim PY. Epidemiology Morbidity And Mortality. (2020 Oct 13). In: StatPearls [Internet]. Treasure Island (FL): StatPearls Publishing; 2021 Jan–. PMID: 31613448. Available https://www.ncbi.nlm.nih.gov/books/NBK547668/↵
- Hanson, A., & Levin, B. (2018-02). Epidemiology, Chapter 4. In Introduction to Public Health in Pharmacy. Oxford, UK: Oxford University Press. Available at: https://oxfordmedicine.com/view/10.1093/med/9780190238308.001.0001/med-9780190238308↵
- Schoenbach, VJ. (2000). Chapter 4. Phenomenon of disease In Epidemiology Net. Available at: http://www.epidemiolog.net/evolving/PhenomenonofDisease.pdf↵
- CDC. (n.d.). Lesson 1 Understanding the Epidemiologic Triangle through Infectious Disease, pdf material. From https://www.cdc.gov/healthyschools/bam/teachers/documents/epi_1_triangle.pdf↵
- Rivier University. (n.d.). What Is the Epidemiologic Triangle? From https://www.rivier.edu/academics/blog-posts/what-is-the-epidemiologic-triangle/↵
- Tsui, B., Deng, A., & Pan, S. (2020). COVID-19: Epidemiological Factors During Aerosol-Generating Medical Procedures. Anesthesia and analgesia, 131(3), e175–e178. From https://www.ncbi.nlm.nih.gov/pmc/articles/PMC7302069/ or, https://doi.org/10.1213/ANE.0000000000005063↵
- No author. (n.d.). Example web of causation for PSA test. Wikimedia Commons. From https://commons.wikimedia.org/wiki/File:Example_web_of_causation_for_PSA_test.jpg↵
- CDC. (n.d.). Social Determinants of Health: Know what affects health. From https://www.cdc.gov/socialdeterminants/↵
- Agrawal, A., Aadesh, G., Kaivalya, D., Supriya, K., Punit, F., Nazli, K. (2021). A Comparative Analysis of the Spanish Flu 1918 and COVID-19 Pandemics. Open Public Health Journal, 14 (1), 128-134. From https://doi.org/10.2174/1874944502114010128↵