
10.4: Diagnosis
- Page ID
- 42781

\( \newcommand{\vecs}[1]{\overset { \scriptstyle \rightharpoonup} {\mathbf{#1}} } \)
\( \newcommand{\vecd}[1]{\overset{-\!-\!\rightharpoonup}{\vphantom{a}\smash {#1}}} \)
\( \newcommand{\dsum}{\displaystyle\sum\limits} \)
\( \newcommand{\dint}{\displaystyle\int\limits} \)
\( \newcommand{\dlim}{\displaystyle\lim\limits} \)
\( \newcommand{\id}{\mathrm{id}}\) \( \newcommand{\Span}{\mathrm{span}}\)
( \newcommand{\kernel}{\mathrm{null}\,}\) \( \newcommand{\range}{\mathrm{range}\,}\)
\( \newcommand{\RealPart}{\mathrm{Re}}\) \( \newcommand{\ImaginaryPart}{\mathrm{Im}}\)
\( \newcommand{\Argument}{\mathrm{Arg}}\) \( \newcommand{\norm}[1]{\| #1 \|}\)
\( \newcommand{\inner}[2]{\langle #1, #2 \rangle}\)
\( \newcommand{\Span}{\mathrm{span}}\)
\( \newcommand{\id}{\mathrm{id}}\)
\( \newcommand{\Span}{\mathrm{span}}\)
\( \newcommand{\kernel}{\mathrm{null}\,}\)
\( \newcommand{\range}{\mathrm{range}\,}\)
\( \newcommand{\RealPart}{\mathrm{Re}}\)
\( \newcommand{\ImaginaryPart}{\mathrm{Im}}\)
\( \newcommand{\Argument}{\mathrm{Arg}}\)
\( \newcommand{\norm}[1]{\| #1 \|}\)
\( \newcommand{\inner}[2]{\langle #1, #2 \rangle}\)
\( \newcommand{\Span}{\mathrm{span}}\) \( \newcommand{\AA}{\unicode[.8,0]{x212B}}\)
\( \newcommand{\vectorA}[1]{\vec{#1}} % arrow\)
\( \newcommand{\vectorAt}[1]{\vec{\text{#1}}} % arrow\)
\( \newcommand{\vectorB}[1]{\overset { \scriptstyle \rightharpoonup} {\mathbf{#1}} } \)
\( \newcommand{\vectorC}[1]{\textbf{#1}} \)
\( \newcommand{\vectorD}[1]{\overrightarrow{#1}} \)
\( \newcommand{\vectorDt}[1]{\overrightarrow{\text{#1}}} \)
\( \newcommand{\vectE}[1]{\overset{-\!-\!\rightharpoonup}{\vphantom{a}\smash{\mathbf {#1}}}} \)
\( \newcommand{\vecs}[1]{\overset { \scriptstyle \rightharpoonup} {\mathbf{#1}} } \)
\(\newcommand{\longvect}{\overrightarrow}\)
\( \newcommand{\vecd}[1]{\overset{-\!-\!\rightharpoonup}{\vphantom{a}\smash {#1}}} \)
\(\newcommand{\avec}{\mathbf a}\) \(\newcommand{\bvec}{\mathbf b}\) \(\newcommand{\cvec}{\mathbf c}\) \(\newcommand{\dvec}{\mathbf d}\) \(\newcommand{\dtil}{\widetilde{\mathbf d}}\) \(\newcommand{\evec}{\mathbf e}\) \(\newcommand{\fvec}{\mathbf f}\) \(\newcommand{\nvec}{\mathbf n}\) \(\newcommand{\pvec}{\mathbf p}\) \(\newcommand{\qvec}{\mathbf q}\) \(\newcommand{\svec}{\mathbf s}\) \(\newcommand{\tvec}{\mathbf t}\) \(\newcommand{\uvec}{\mathbf u}\) \(\newcommand{\vvec}{\mathbf v}\) \(\newcommand{\wvec}{\mathbf w}\) \(\newcommand{\xvec}{\mathbf x}\) \(\newcommand{\yvec}{\mathbf y}\) \(\newcommand{\zvec}{\mathbf z}\) \(\newcommand{\rvec}{\mathbf r}\) \(\newcommand{\mvec}{\mathbf m}\) \(\newcommand{\zerovec}{\mathbf 0}\) \(\newcommand{\onevec}{\mathbf 1}\) \(\newcommand{\real}{\mathbb R}\) \(\newcommand{\twovec}[2]{\left[\begin{array}{r}#1 \\ #2 \end{array}\right]}\) \(\newcommand{\ctwovec}[2]{\left[\begin{array}{c}#1 \\ #2 \end{array}\right]}\) \(\newcommand{\threevec}[3]{\left[\begin{array}{r}#1 \\ #2 \\ #3 \end{array}\right]}\) \(\newcommand{\cthreevec}[3]{\left[\begin{array}{c}#1 \\ #2 \\ #3 \end{array}\right]}\) \(\newcommand{\fourvec}[4]{\left[\begin{array}{r}#1 \\ #2 \\ #3 \\ #4 \end{array}\right]}\) \(\newcommand{\cfourvec}[4]{\left[\begin{array}{c}#1 \\ #2 \\ #3 \\ #4 \end{array}\right]}\) \(\newcommand{\fivevec}[5]{\left[\begin{array}{r}#1 \\ #2 \\ #3 \\ #4 \\ #5 \\ \end{array}\right]}\) \(\newcommand{\cfivevec}[5]{\left[\begin{array}{c}#1 \\ #2 \\ #3 \\ #4 \\ #5 \\ \end{array}\right]}\) \(\newcommand{\mattwo}[4]{\left[\begin{array}{rr}#1 \amp #2 \\ #3 \amp #4 \\ \end{array}\right]}\) \(\newcommand{\laspan}[1]{\text{Span}\{#1\}}\) \(\newcommand{\bcal}{\cal B}\) \(\newcommand{\ccal}{\cal C}\) \(\newcommand{\scal}{\cal S}\) \(\newcommand{\wcal}{\cal W}\) \(\newcommand{\ecal}{\cal E}\) \(\newcommand{\coords}[2]{\left\{#1\right\}_{#2}}\) \(\newcommand{\gray}[1]{\color{gray}{#1}}\) \(\newcommand{\lgray}[1]{\color{lightgray}{#1}}\) \(\newcommand{\rank}{\operatorname{rank}}\) \(\newcommand{\row}{\text{Row}}\) \(\newcommand{\col}{\text{Col}}\) \(\renewcommand{\row}{\text{Row}}\) \(\newcommand{\nul}{\text{Nul}}\) \(\newcommand{\var}{\text{Var}}\) \(\newcommand{\corr}{\text{corr}}\) \(\newcommand{\len}[1]{\left|#1\right|}\) \(\newcommand{\bbar}{\overline{\bvec}}\) \(\newcommand{\bhat}{\widehat{\bvec}}\) \(\newcommand{\bperp}{\bvec^\perp}\) \(\newcommand{\xhat}{\widehat{\xvec}}\) \(\newcommand{\vhat}{\widehat{\vvec}}\) \(\newcommand{\uhat}{\widehat{\uvec}}\) \(\newcommand{\what}{\widehat{\wvec}}\) \(\newcommand{\Sighat}{\widehat{\Sigma}}\) \(\newcommand{\lt}{<}\) \(\newcommand{\gt}{>}\) \(\newcommand{\amp}{&}\) \(\definecolor{fillinmathshade}{gray}{0.9}\)The diagnosis of PE is based primarily on validated clinical criteria combined with selective testing because the typical clinical presentation (shortness of breath, chest pain) cannot be definitively differentiated from other causes of chest pain and shortness of breath. The decision to do medical imaging is usually based on clinical grounds, i.e. the medical history, symptoms and findings on physical examination, followed by an assessment of clinical probability.[1]
The most commonly used method to predict clinical probability, the Wells score, is a clinical prediction rule, whose use is complicated by multiple versions being available. In 1995, Wells et al. initially developed a prediction rule (based on a literature search) to predict the likelihood of PE, based on clinical criteria.[3] The prediction rule was revised in 1998 [4] This prediction rule was further revised when simplified during a validation by Wells et al. in 2000. [5] In the 2000 publication, Wells proposed two different scoring systems using cutoffs of 2 or 4 with the same prediction rule. [5] In 2001, Wells published results using the more conservative cutoff of 2 to create three categories.[6] An additional version, the "modified extended version", using the more recent cutoff of 2 but including findings from Wells's initial studies[7] [8] were proposed. [9] Most recently, a further study reverted to Wells's earlier use of a cutoff of 4 points [5] to create only two categories. [10]
There are additional prediction rules for PE, such as the Geneva rule. More importantly, the use of any rule is associated with reduction in recurrent thromboembolism. [11]
The Wells score: [12]
- clinically suspected DVT - 3.0 points
- alternative diagnosis is less likely than PE - 3.0 points
- tachycardia - 1.5 points
- immobilization/surgery in previous four weeks - 1.5 points
- history of DVT or PE - 1.5 points
- hemoptysis - 1.0 points
- malignancy (treatment for within 6 months, palliative) - 1.0 points
Traditional interpretation [5][6] [13]
- Score >6.0 - High (probability 59% based on pooled data [14])
- Score 2.0 to 6.0 - Moderate (probability 29% based on pooled data [14])
- Score <2.0 - Low (probability 15% based on pooled data [14])
Alternative interpretation [5][10]
- Score > 4 - PE likely. Consider diagnostic imaging.
- Score 4 or less - PE unlikely. Consider D-dimer to rule out PE.
Blood tests
Early primary research has shown that in low/moderate suspicion of PE, a normal D-dimer level (shown in a blood test) is enough to exclude the possibility of thrombotic PE. [15] This has been corroborated by a recent systematic review of studies of patients with low pre-test probability (PTP) of PE and negative D-dimer results that found the three month risk of thromboembolic events in patients excluded in this manner was 0.14%, with 95% confidence intervals from 0.05 to 0.41%, though this review was limited by its use of only one randomized-controlled clinical trial, the remainder of studies being prospective cohorts. [16] D-dimer is highly sensitive but not very specific (specificity around 50%). In other words, a positive D-dimer is not synonymous with PE, but a negative D-dimer is, with a good degree of certainty, an indication of absence of a PE. [17]
When a PE is being suspected, a number of blood tests are done, in order to exclude important secondary causes of PE. This includes a full blood count, clotting status (PT, aPTT, TT), and some screening tests (erythrocyte sedimentation rate, renal function, liver enzymes, electrolytes). If one of these is abnormal, further investigations might be warranted.
Imaging

The gold standard for diagnosing pulmonary embolism (PE) is pulmonary angiography. Pulmonary angiography is used less often due to wider acceptance of CT scans, which are non-invasive. CT pulmonary angiography is the recommended first line diagnostic imaging test in most people.
Non-invasive imaging
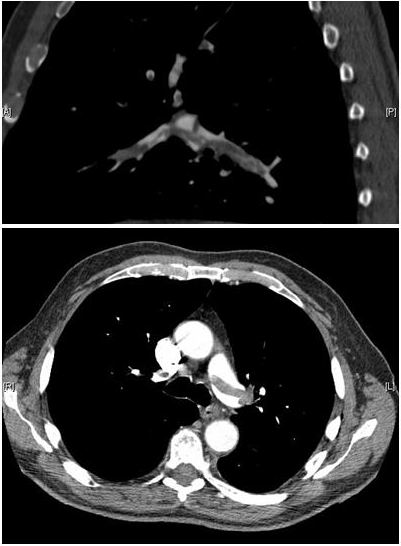
CT pulmonary angiography (CTPA) is a pulmonary angiogram obtained using computed tomography (CT) with radiocontrast rather than right heart catheterization. Its advantages are clinical equivalence, its non-invasive nature, its greater availability to patients, and the possibility of identifying other lung disorders from the differential diagnosis in case there is no pulmonary embolism. Assessing the accuracy of CT pulmonary angiography is hindered by the rapid changes in the number of rows of detectors available in multidetector CT (MDCT) machines. [18] According to a cohort study, single-slice spiral CT may help diagnose detection among patients with suspected pulmonary embolism. [19] In this study, the sensitivity was 69% and specificity was 84%. In this study which had a prevalence of detection was 32%, the positive predictive value of 67.0% and negative predictive value of 85.2% (click here to adjust these results for patients at higher or lower risk of detection). However, this study's results may be biased due to possible incorporation bias, since the CT scan was the final diagnostic tool in patients with pulmonary embolism. The authors noted that a negative single slice CT scan is insufficient to rule out pulmonary embolism on its own. A separate study with a mixture of 4 slice and 16 slice scanners reported a sensitivity of 83% and a specificity of 96%. This study noted that additional testing is necessary when the clinical probability is inconsistent with the imaging results. [20] CTPA is non-inferior to VQ scanning, and identifies more emboli (without necessarily improving the outcome) compared to VQ scanning. [21]
Ventilation/perfusion scan (or V/Q scan or lung scintigraphy), which shows that some areas of the lung are being ventilated but not perfused with blood (due to obstruction by a clot). This type of examination is used less often because of the more widespread availability of CT technology, however, it may be useful in patients who have an allergy to iodinated contrast or in pregnancy due to lower radiation exposure than CT. [22]

Low probability diagnostic tests/non-diagnostic tests
Tests that are frequently done that are not sensitive for PE, but can be diagnostic.
- Chest X-rays are often done on patients with shortness of breath to help rule-out other causes, such as congestive heart failure and rib fracture. Chest X-rays in PE are rarely normal, [23] but usually lack signs that suggest the diagnosis of PE (e.g. Westermark sign, Hampton's hump).
- Ultrasonography of the legs, also known as leg doppler, in search of deep venous thrombosis (DVT). The presence of DVT, as shown on ultrasonography of the legs, is in itself enough to warrant anticoagulation, without requiring the V/Q or spiral CT scans (because of the strong association between DVT and PE). This may be valid approach in pregnancy, in which the other modalities would increase the risk of birth defects in the unborn child. However, a negative scan does not rule out PE, and low-radiation dose scanning may be required if the mother is deemed at high risk of having pulmonary embolism.
Electrocardiogram

An electrocardiogram (ECG) is routinely done on patients with chest pain to quickly diagnose myocardial infarctions (heart attacks). An ECG may show signs of right heart strain or acute cor pulmonale in cases of large PEs - the classic signs are a large S wave in lead I, a large Q wave in lead III and an inverted T wave in lead III ("S1Q3T3"). [24] This is occasionally (up to 20%) present, but may also occur in other acute lung conditions and has therefore limited diagnostic value. The most commonly seen signs in the ECG is sinus tachycardia, right axis deviation and right bundle branch block. [25] Sinus tachycardia was however still only found in 8 - 69% of people with PE. [26]
Echocardiography
In massive and submassive PE, dysfunction of the right side of the heart can be seen on echocardiography, an indication that the pulmonary artery is severely obstructed and the heart is unable to match the pressure. Some studies (see below) suggest that this finding may be an indication for thrombolysis. Not every patient with a (suspected) pulmonary embolism requires an echocardiogram, but elevations in cardiac troponins or brain natriuretic peptide may indicate heart strain and warrant an echocardiogram. [27]
The specific appearance of the right ventricle on echocardiography is referred to as the McConnell's sign. This is the finding of akinesia of the mid-free wall but normal motion of the apex. This phenomenon has a 77% sensitivity and a 94% specificity for the diagnosis of acute pulmonary embolism in the setting of right ventricular dysfunction. [28]
Algorithms
Recent recommendations for a diagnostic algorithm have been published by the PIOPED investigators; however, these recommendations do not reflect research using 64 slice MDCT. [29] These investigators recommended:
- Low clinical probability. If negative D-dimer, PE is excluded. If positive D-dimer, obtain MDCT and based treatment on results.
- Moderate clinical probability. If negative D-dimer, PE is excluded. However, the authors were not concerned that a negative MDCT with negative D-dimer in this setting has an 5% probability of being false. Presumably, the 5% error rate will fall as 64 slice MDCT is more commonly used. If positive D-dimer, obtain MDCT and based treatment on results.
- High clinical probability. Proceed to MDCT. If positive, treat, if negative, additional tests are needed to exclude PE.
Pulmonary Embolism Rule-out Criteria
The Pulmonary Embolism Rule-out Criteria, or PERC rule, helps assess people in whom pulmonary embolism is suspected, but unlikely. Unlike the Wells Score and Geneva score, which are clinical prediction rules intended to risk stratify patients with suspected PE, the PERC rule is designed to rule out risk of PE in patients when the physician has already stratified them into a low-risk category.
Patients in this low risk category without any of these criteria may undergo no further diagnostic testing for PE: Hypoxia - Sa02 <95%, unilateral leg swelling, hemoptysis, prior DVT or PE, recent surgery or trauma, age >50, hormone use, tachycardia. The rationale behind this decision is that further testing (specifically CT angiogram of the chest) may cause more harm (from radiation exposure and contrast dye) than the risk of PE. [30] The PERC rule has a sensitivity of 97.4% and specificity of 21.9% with a false negative rate of 1.0% (16/1666). [31]