
8.10: Water Concerns
- Page ID
- 40627

\( \newcommand{\vecs}[1]{\overset { \scriptstyle \rightharpoonup} {\mathbf{#1}} } \)
\( \newcommand{\vecd}[1]{\overset{-\!-\!\rightharpoonup}{\vphantom{a}\smash {#1}}} \)
\( \newcommand{\dsum}{\displaystyle\sum\limits} \)
\( \newcommand{\dint}{\displaystyle\int\limits} \)
\( \newcommand{\dlim}{\displaystyle\lim\limits} \)
\( \newcommand{\id}{\mathrm{id}}\) \( \newcommand{\Span}{\mathrm{span}}\)
( \newcommand{\kernel}{\mathrm{null}\,}\) \( \newcommand{\range}{\mathrm{range}\,}\)
\( \newcommand{\RealPart}{\mathrm{Re}}\) \( \newcommand{\ImaginaryPart}{\mathrm{Im}}\)
\( \newcommand{\Argument}{\mathrm{Arg}}\) \( \newcommand{\norm}[1]{\| #1 \|}\)
\( \newcommand{\inner}[2]{\langle #1, #2 \rangle}\)
\( \newcommand{\Span}{\mathrm{span}}\)
\( \newcommand{\id}{\mathrm{id}}\)
\( \newcommand{\Span}{\mathrm{span}}\)
\( \newcommand{\kernel}{\mathrm{null}\,}\)
\( \newcommand{\range}{\mathrm{range}\,}\)
\( \newcommand{\RealPart}{\mathrm{Re}}\)
\( \newcommand{\ImaginaryPart}{\mathrm{Im}}\)
\( \newcommand{\Argument}{\mathrm{Arg}}\)
\( \newcommand{\norm}[1]{\| #1 \|}\)
\( \newcommand{\inner}[2]{\langle #1, #2 \rangle}\)
\( \newcommand{\Span}{\mathrm{span}}\) \( \newcommand{\AA}{\unicode[.8,0]{x212B}}\)
\( \newcommand{\vectorA}[1]{\vec{#1}} % arrow\)
\( \newcommand{\vectorAt}[1]{\vec{\text{#1}}} % arrow\)
\( \newcommand{\vectorB}[1]{\overset { \scriptstyle \rightharpoonup} {\mathbf{#1}} } \)
\( \newcommand{\vectorC}[1]{\textbf{#1}} \)
\( \newcommand{\vectorD}[1]{\overrightarrow{#1}} \)
\( \newcommand{\vectorDt}[1]{\overrightarrow{\text{#1}}} \)
\( \newcommand{\vectE}[1]{\overset{-\!-\!\rightharpoonup}{\vphantom{a}\smash{\mathbf {#1}}}} \)
\( \newcommand{\vecs}[1]{\overset { \scriptstyle \rightharpoonup} {\mathbf{#1}} } \)
\(\newcommand{\longvect}{\overrightarrow}\)
\( \newcommand{\vecd}[1]{\overset{-\!-\!\rightharpoonup}{\vphantom{a}\smash {#1}}} \)
\(\newcommand{\avec}{\mathbf a}\) \(\newcommand{\bvec}{\mathbf b}\) \(\newcommand{\cvec}{\mathbf c}\) \(\newcommand{\dvec}{\mathbf d}\) \(\newcommand{\dtil}{\widetilde{\mathbf d}}\) \(\newcommand{\evec}{\mathbf e}\) \(\newcommand{\fvec}{\mathbf f}\) \(\newcommand{\nvec}{\mathbf n}\) \(\newcommand{\pvec}{\mathbf p}\) \(\newcommand{\qvec}{\mathbf q}\) \(\newcommand{\svec}{\mathbf s}\) \(\newcommand{\tvec}{\mathbf t}\) \(\newcommand{\uvec}{\mathbf u}\) \(\newcommand{\vvec}{\mathbf v}\) \(\newcommand{\wvec}{\mathbf w}\) \(\newcommand{\xvec}{\mathbf x}\) \(\newcommand{\yvec}{\mathbf y}\) \(\newcommand{\zvec}{\mathbf z}\) \(\newcommand{\rvec}{\mathbf r}\) \(\newcommand{\mvec}{\mathbf m}\) \(\newcommand{\zerovec}{\mathbf 0}\) \(\newcommand{\onevec}{\mathbf 1}\) \(\newcommand{\real}{\mathbb R}\) \(\newcommand{\twovec}[2]{\left[\begin{array}{r}#1 \\ #2 \end{array}\right]}\) \(\newcommand{\ctwovec}[2]{\left[\begin{array}{c}#1 \\ #2 \end{array}\right]}\) \(\newcommand{\threevec}[3]{\left[\begin{array}{r}#1 \\ #2 \\ #3 \end{array}\right]}\) \(\newcommand{\cthreevec}[3]{\left[\begin{array}{c}#1 \\ #2 \\ #3 \end{array}\right]}\) \(\newcommand{\fourvec}[4]{\left[\begin{array}{r}#1 \\ #2 \\ #3 \\ #4 \end{array}\right]}\) \(\newcommand{\cfourvec}[4]{\left[\begin{array}{c}#1 \\ #2 \\ #3 \\ #4 \end{array}\right]}\) \(\newcommand{\fivevec}[5]{\left[\begin{array}{r}#1 \\ #2 \\ #3 \\ #4 \\ #5 \\ \end{array}\right]}\) \(\newcommand{\cfivevec}[5]{\left[\begin{array}{c}#1 \\ #2 \\ #3 \\ #4 \\ #5 \\ \end{array}\right]}\) \(\newcommand{\mattwo}[4]{\left[\begin{array}{rr}#1 \amp #2 \\ #3 \amp #4 \\ \end{array}\right]}\) \(\newcommand{\laspan}[1]{\text{Span}\{#1\}}\) \(\newcommand{\bcal}{\cal B}\) \(\newcommand{\ccal}{\cal C}\) \(\newcommand{\scal}{\cal S}\) \(\newcommand{\wcal}{\cal W}\) \(\newcommand{\ecal}{\cal E}\) \(\newcommand{\coords}[2]{\left\{#1\right\}_{#2}}\) \(\newcommand{\gray}[1]{\color{gray}{#1}}\) \(\newcommand{\lgray}[1]{\color{lightgray}{#1}}\) \(\newcommand{\rank}{\operatorname{rank}}\) \(\newcommand{\row}{\text{Row}}\) \(\newcommand{\col}{\text{Col}}\) \(\renewcommand{\row}{\text{Row}}\) \(\newcommand{\nul}{\text{Nul}}\) \(\newcommand{\var}{\text{Var}}\) \(\newcommand{\corr}{\text{corr}}\) \(\newcommand{\len}[1]{\left|#1\right|}\) \(\newcommand{\bbar}{\overline{\bvec}}\) \(\newcommand{\bhat}{\widehat{\bvec}}\) \(\newcommand{\bperp}{\bvec^\perp}\) \(\newcommand{\xhat}{\widehat{\xvec}}\) \(\newcommand{\vhat}{\widehat{\vvec}}\) \(\newcommand{\uhat}{\widehat{\uvec}}\) \(\newcommand{\what}{\widehat{\wvec}}\) \(\newcommand{\Sighat}{\widehat{\Sigma}}\) \(\newcommand{\lt}{<}\) \(\newcommand{\gt}{>}\) \(\newcommand{\amp}{&}\) \(\definecolor{fillinmathshade}{gray}{0.9}\)At this point you have learned how critical water is to support human life, how it is distributed and moved in the body, how fluid balance and composition is maintained, and the recommended amount of fluids a person should consume daily. In America you have a choice of thousands of different beverages. Which should you choose to receive the most health benefit and achieve your recommended fluid intake?
Reading the Label
Most beverages marketed in the United States have a Nutrition Facts panel and ingredients list, but some, such as coffee (for home consumption), beer, and wine, do not. As with foods, beverages that are nutrient-dense are the better choices, with the exception of plain water, which contains few to no other nutrients. Beverages do not make you full; they satiate your thirst. Therefore, the fewer calories in a beverage the better it is for avoiding weight gain. For an estimate of kilocalories in various beverages see Table \(\PageIndex{1}\).
| Beverage | Serving Size (oz) | Kilocalories |
|---|---|---|
| Soda | 12.0 | 124–189 |
| Bottled sweet tea | 12.0 | 129–143 |
| Orange juice | 12.0 | 157–168 |
| Tomato/vegetable juice | 12.0 | 80 |
| Whole milk | 12.0 | 220 |
| Nonfat milk | 12.0 | 125 |
| Soy milk | 12.0 | 147–191 |
| Coffee, black | 12.0 | 0–4 |
| Coffee, with cream | 12.0 | 39–43 |
| Caffe latte, whole milk | 12.0 | 200 |
| Sports drink | 12.0 | 94 |
| Beer | 12.0 | 153 |
| White wine | 5.0 | 122 |
Beverage Consumption in the United States
According to the Beverage Marketing Corporation, in the United States in 2010 Americans consumed 29,325 millions of gallons of refreshment beverages including soft drinks, coffee, tea, sports drinks, energy drinks, fruit drinks, and bottled water.[1]
As in the past, carbonated soft drinks remained the largest category of consumed beverages. In recent decades total caloric consumption has increased in the United States and is largely attributed to increased consumption of snacks and caloric beverages. People between the ages of nineteen and thirty-nine obtain 10 percent of their total energy intake from soft drinks.[2]
In all age groups the consumption of total beverages provides, on average, 21 percent of daily caloric intake. This is 7 percent higher than the IOM acceptable caloric intake from beverages. Moreover, the high intakes of soft drinks and sugary beverages displace the intake of more nutrient-dense beverages, such as low-fat milk.
Scientific studies have demonstrated that while all beverages are capable of satisfying thirst they do not make you feel full, or satiated. This means that drinking a calorie-containing beverage with a meal only provides more calories, as it won’t be offset by eating less food. The Beverage Panel of the University of North Carolina, Chapel Hill has taken on the challenge of scientifically evaluating the health benefits and risks of beverage groups and providing recommendations for beverage groups (Table \(\PageIndex{2}\)). In regards to soft drinks and fruit drinks, The Beverage Panel states that they increase energy intake, are not satiating, and that there is little if any reduction in other foods to compensate for the excess calories. All of these factors contribute to increased energy intake and obesity.[3]
The Beverage Panel recommends an even lower intake of calories from beverages than IOM—10 percent or less of total caloric intake.
| Beverage | Servings per day* |
|---|---|
| Water | ≥ 4 (women), ≥ 6 (men) |
| Unsweetened coffee and tea | ≤ 8 for tea, ≤ 4 for coffee |
| Nonfat and low-fat milk; fortified soy drinks | ≤ 2 |
| Diet beverages with sugar substitutes | ≤ 4 |
| 100 percent fruit juices, whole milk, sports drinks | ≤ 1 |
| Calorie-rich beverages without nutrients | ≤ 1, less if trying to lose weight |
| *One serving is eight ounces. |
Source: Beverage Panel Recommendations and Analysis. University of North Carolina, Chapel Hill. US Beverage Guidance Council. http://www.cpc.unc.edu/projects/nutrans/policy/beverage/us-beverage-panel. Accessed November 6, 2012.
Sources of Drinking Water
The Beverage Panel recommends that women drink at least 32 ounces and men drink at least 48 ounces of water daily. In 1974, the US federal government enacted The Safe Drinking Water Act with the intention of providing the American public with safe drinking water. This act requires the Environmental Protection Agency (EPA) to set water-quality standards and assure that the 150,000-plus public water systems in the country adhere to the standards. About 15 percent of Americans obtain drinking water from private wells, which are not subject to EPA standards. Producing water safe for drinking involves some or all of the following processes: screening out large objects, removing excess calcium carbonate from hard water sources, flocculation, which adds a precipitating agent to remove solid particles, clarification, sedimentation, filtration, and disinfection. These processes aim to remove unhealthy substances and produce high-quality, colorless, odorless, good-tasting water. Most drinking water is disinfected by the process of chlorination, which involves adding chlorine compounds to the water. Chlorination is cheap and effective at killing bacteria. However, it is less effective at removing protozoa, such as Giardia lamblia. Chlorine-resistant protozoa and viruses are instead removed by extensive filtration methods. In the decades immediately following the implementation of water chlorination and disinfection methods in this country, waterborne illnesses, such as cholera and typhoid fever, essentially disappeared in the United States (Figure \(\PageIndex{1}\)). In fact, the treatment of drinking water is touted as one of the top public-health achievements of the last century.
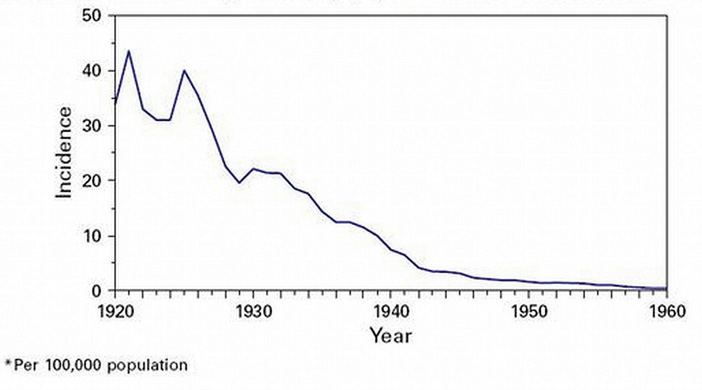 Figure \(\PageIndex{1}\): Deadly Water-borne Illnesses In United States. Deadly water-borne illnesses decreased to almost nonexistent levels in the United States after the implementation of water disinfection methods. Source: Image credit Robert Tauxe. Drinking Water Week. Centers for Disease Control and Prevention. http://www.cdc.gov/features/drinkingwater/graph.html. Updated May 17, 2012. Aceessed September 22, 2017.
Chlorine reaction with inadequately filtered water can result in the formation of potentially harmful substances. Some of these chlorinated compounds, when present at extremely high levels, have been shown to cause cancer in studies conducted in rodents. In addition to many other contaminants, the EPA has set maximum contaminant levels (legal threshold limits) for these chlorinated compounds in water, in order to guard against disease risk. The oversight of public water systems in this country is not perfect and water-borne illnesses are significantly underreported; however, there are far fewer cases of water-borne illnesses than those attributed to food-borne illnesses that have occurred in the recent past.
Resources
- US Liquid Refreshment Beverage Market Increased by 1.2% in 2010, Beverage Marketing Corporation Reports. Beverage Marketing Corporation. http://www.beveragemarketing.com/?section=pressreleases. Published 2010. Accessed March 17, 2011. ↵
- Beverage Intake in the United States. The Beverage Panel, University of North Carolina, Chapel Hill. http://www.cpc.unc.edu/projects/beverage. Accessed October 2, 2011. (See Figure 6.8.) ↵
- US Liquid Refreshment Beverage Market Increased by 1.2% in 2010, Beverage Marketing Corporation Reports.Beverage Marketing Corporation. http://www.beveragemarketing.com/?section=pressreleases. Accessed March 17, 2011. ↵